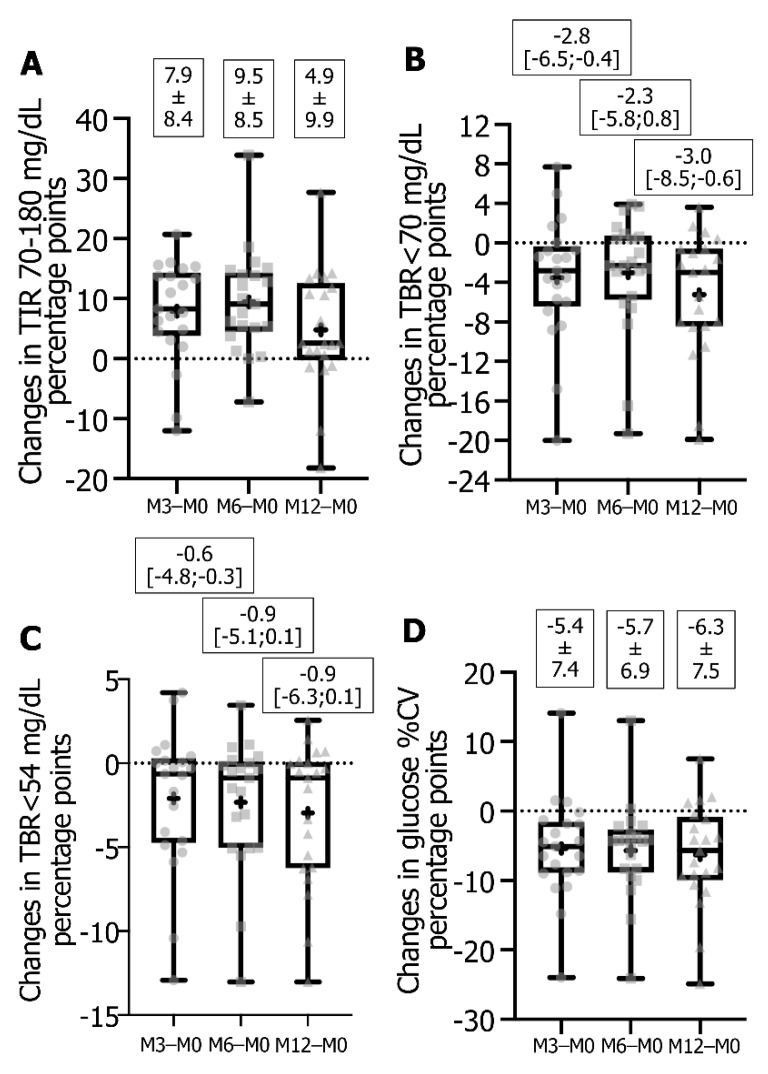
Figure 2.
Box-and-whisker plot of changes in TIR (A), TBR < 70 mg/dL (B), TBR < 54 mg/dL (C) and glucose %CV (D). Data represented as plots are median, first quartile (Q1 or 25th percentile) and third quartile (Q3 or 75th percentile), min and max, mean (as a cross) and all individual points for changes calculated from DG4 parameter at M3 or M6 or M12 − FSL1 parameters expressed as percentage points. Values indicated are means ± SD or median [Q1;Q3]. Data are from 21 T1D followed-up patients. Abbreviations: %CV, glucose % coefficient of variability; DG4, Dexcom platinum G4; FSL1, FreeStyle Libre version 1; TBR, time-below-range; TIR, time-in-range.

