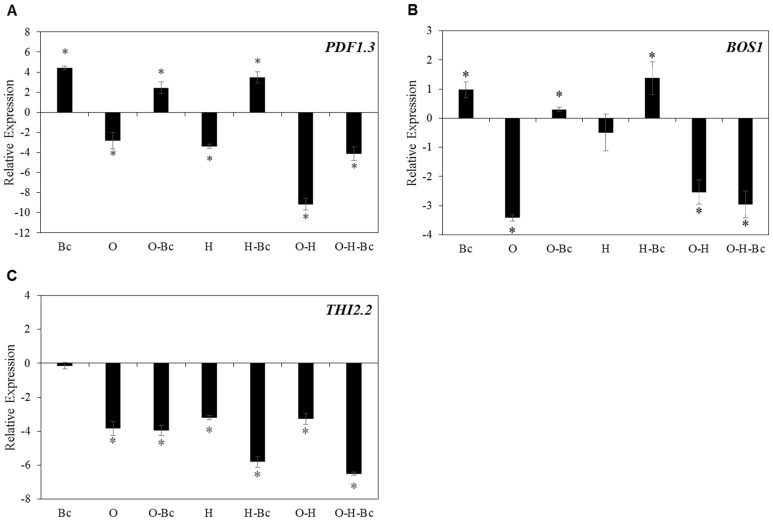
Figure 4.
Effect of individual and combined osmotic, heat and Botrytis cinerea (Bc) treatments on the expression of AtPDF1-3 (A), AtBOS1 (B) and AtTHI2.2 (C) genes in Arabidopsis plants (Col-0). Bc was applied 16 h after the abiotic stress treatments. Leaves were sampled 48 h after ¼ strength PDB solution (mock) or Bc treatments. O: osmotic stress, H: heat. Data are represented as log2 fold change, normalized with reference gene (plant biomass expressed protein, expG) and relative to the control. The zero-line represents plants mock-treated with ¼ strength PDB solution. Bars represent the mean and standard deviation of three biological replicates. Asterisks indicate significant differences, 1-way ANOVA; post-hoc LSD, * p < 0.05.

