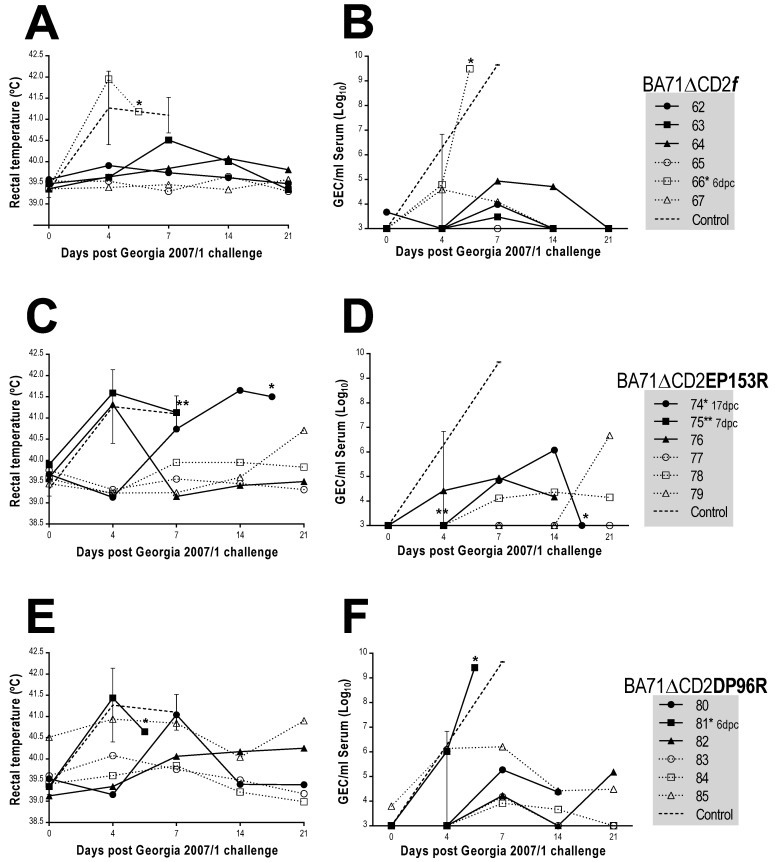
Figure 6.
Rectal temperatures measured and ASFV DNA amount found in sera of immunized and control pigs after Georgia2007/1 challenge. Data plotted correspond to individual animals showing rectal temperatures (A,C,E) and virus loads in serum (B,D,F). Upper panels show data corresponding to BA71∆CD2f immunized pigs, middle panels to BA71∆CD2EP153R and lower panels to BA71∆CD2DP96R. Average and standard deviation values obtained from control animals are also depicted. Virus titers are plotted on a logarithmic scale as GEC per milliliter of serum, 103 GEC/mL serum being the limit of detection of the assay. * Day of the death of the animals. Last data recorded for pig 75 correspond to day 6pc (death date).

