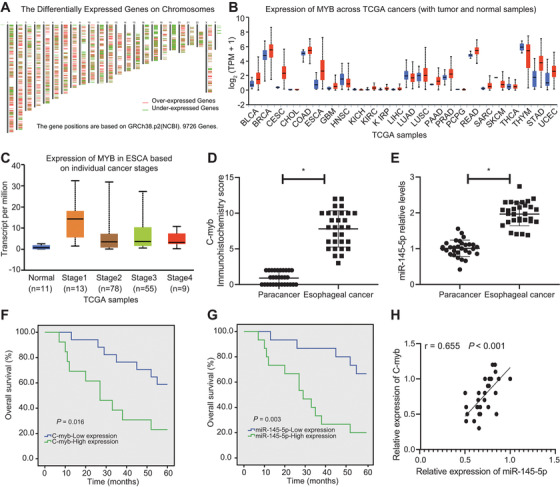
FIGURE 2.

c‐Myb and miR‐145‐5p are highly expressed in EAC, and are associated with dismal prognosis. (A) Heat maps of expression of EAC‐related DEGs in TCGA, wherein the upper abscissa represents the number of chromosomes, red represents highly expressed genes, and green represents lowly expressed genes; each line represents a gene, the position of which represents the position of this gene in the chromosome. (B) The expression of c‐Myb in TCGA, wherein the abscissa represents the type of disease, the red boxes represent EAC samples, and the blue boxes represent normal samples. (C) The expression of c‐Myb in EAC of different stages, wherein the abscissa represents the sample stage, and the ordinate represents the expression value; the blue box plot on the left represents the c‐Myb expression in normal samples, and the other four box plots represent EAC of different disease stages. (D) IHC scoring of c‐Myb in clinical samples (n = 30). (E) RT‐qPCR determination of miR‐145‐5p expression in EAC samples and tumor adjacent samples (n = 30). (F) Regression analysis of the correlation of c‐Myb expression with the total survival of EAC patients. (G) Regression analysis of the correlation of miR‐145‐5p expression with the total survival of EAC patients. (H) Analysis of the correlation of c‐Myb expression with miR‐145‐5p expression in EAC samples. *P < 0.05. Measurement data were expressed as the mean ± standard deviation. Paired t‐test was used for data analysis in panels E and F, Kaplan–Meier method was used to calculate survival rate of patients followed by one‐way ANOVA using Log‐rank test in panels G and H, and correlation analysis was conducted in panel I
