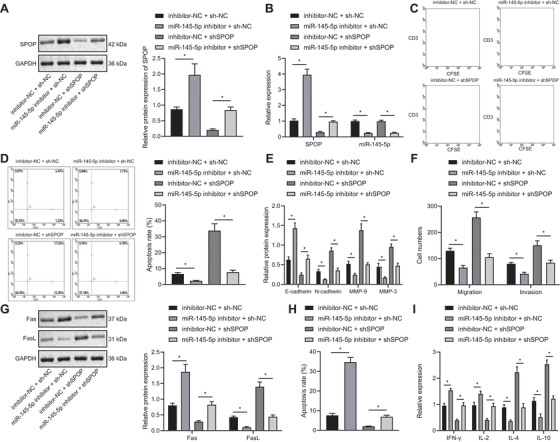
FIGURE 6.

miR‐145‐5p inhibits the activity of T cells, and promotes immune escape of EAC cells (FLO‐1 cell line) by restraining the expression of SPOP. (A) The expression of SPOP in each group assessed by Western blot analysis. (B) The expression of SPOP and miR‐145‐5p in each group detected using qPCR. (C) Proliferation of T cells cocultured with different groups of FLO‐1 cells examined using CFSE dye and CD3 antibody. (D) Apoptosis of T cells cocultured with different groups of FLO‐1 cells detected using flow cytometry combining with CD3 antibody. (E) The expression of E‐cadherin, N‐ cadherin, MMP‐9, and MMP‐3 in FLO‐1 cells of each group detected by Western blot analysis. (F) The invasion and migration of different groups of FLO‐1 cells detected by Transwell assay. (G) The expression of Fas and FasL in FLO‐1 cells of each group detected using Western blot analysis. (H) Apoptosis of FLO‐1 cells in different groups detected by flow cytometry. (I) The cytokine levels secreted by T cells in each group detected by ELISA. *P < .05. Measurement data were expressed as mean ± standard deviation. Data in panel C were analyzed by two‐way ANOVA, and in other panels were analyzed by one‐way ANOVA and Tukey's post‐hoc test
