
FIGURE 9.
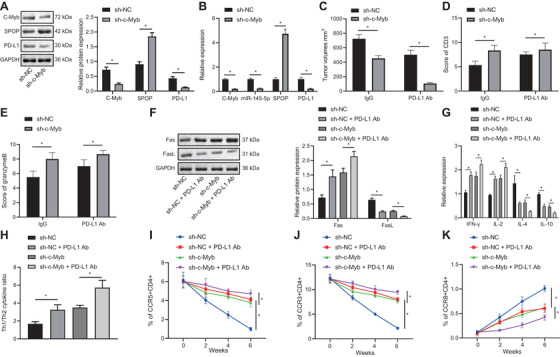
c‐Myb promotes immune escape of EAC cells (FLO‐1 cell line) by upregulating the expression of miR‐145‐5p. (A) c‐Myb, SPOP, and PD‐L1 expression in each group detected by Western blot analysis. (B) The expression of c‐Myb, miR‐145‐5p, SPOP, and PD‐L1 in each group detected using qPCR. (C) Tumor size of EAC tumor models in each group. (D) IHC diagrams of CD3 expression in EAC tissues in each group and statistical analysis of IHC scores. (E) IHC diagrams of Granzymes B expression in EAC tissues in each group and statistical analysis of IHC scores. (F) The expression of Fas and FasL in tumor tissues of each group detected by Western blot analysis. (G) The levels of cytokines secreted by T cells in each group detected using ELISA. (H) The proportion of cytokines secreted by Th1 and Th2 cells in each group detected using specific kits. (I) The proportion of CCR5 and CD4 double positive cells detected using flow cytometry. (J) The proportion of CCR3 and CD4 double positive cells assessed using flow cytometry. (K) The proportion of CCR8 and CD4 double‐positive cells assessed using flow cytometry. *P < .05. Measurement data were expressed as mean ± standard deviation. Data in panels A‐E were analyzed by unpaired t‐test, in panels F‐H were analyzed by one‐way ANOVA, and in panels I‐K were analyzed by two‐way ANOVA and Tukey's post‐hoc test