
FIGURE 3.
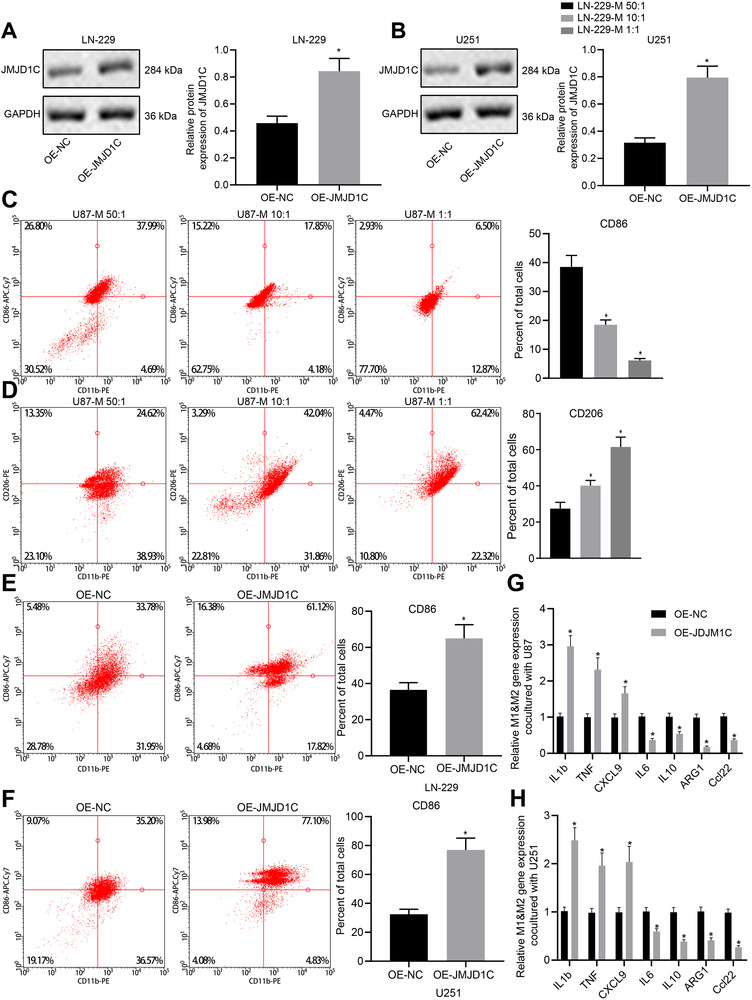
Specific expression of JMJD1C in glioma promotes M1 macrophage polarization in vitro. (A) The protein expression of JMJD1C in LN‐229 cells stably transfected with OE‐NC and OE‐JMJD1C detected by immunoblotting. * p < 0.05 compared with the cells treated with OE‐NC. (B) The protein expression of JMJD1C in U251 cells stably transfected with OE‐NC and OE‐JMJD1C detected by immunoblotting. * p < 0.05 compared with the cells treated with OE‐NC. (C) Expression of CD86 in human CD14+ monocytes co‐cultured with different LN‐229 cells for 4 days detected by quantitative flow cytometry. * p < 0.05 compared with the cells treated with LN‐229‐M 50: 1. (D) Expression of CD206 (D) in human CD14+ monocytes co‐cultured with different LN‐229 cells for 4 days detected by quantitative flow cytometry. * p < 0.05 compared with the cells treated with LN‐229‐M 50: 1. (E) CD14+ monocytes co‐cultured with LN‐229 at a ratio of 1:50 for four days, and the expression of CD86 was detected by quantitative flow cytometry. * p < 0.05 compared with the cells treated with OE‐NC. (F) CD14+ monocytes co‐cultured with U251 at a ratio of 1:50 for four days, and the expression of CD86 was detected by quantitative flow cytometry. * p < 0.05 compared with the cells treated with OE‐NC. (G) Expression of macrophage M1 and M2 markers in CD14+ monocytes co‐cultured with LN‐229cells measured by RT‐qPCR. * p < 0.05 compared with the cells treated with OE‐NC. (H) Expression of macrophage M1 and M2 markers in CD14+ monocytes co‐cultured with U251 cells measured by RT‐qPCR. * p < 0.05 compared with the cells treated with OE‐NC. The measurement data are expressed as mean ± SD. Comparison between glioma tissues and adjacent normal tissues is performed using paired t‐test, while comparison among multiple groups is conducted using one‐way ANOVA and Tukey's post hoc test. The cellular experiment is carried out three times independently