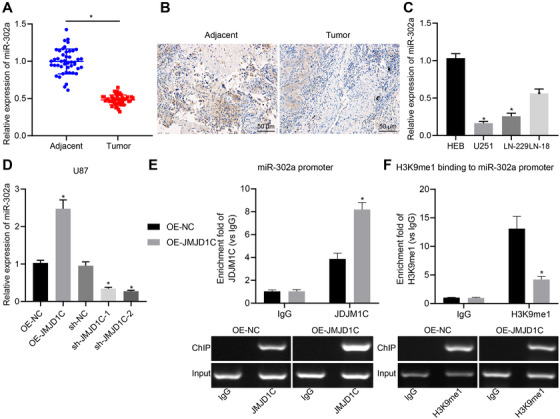
FIGURE 4.

JMJD1C promotes the expression of miR‐302a by regulating H3K9 demethylation. (A) Expression of miR‐302a in glioma tissues (n = 45) and adjacent normal tissues (n = 45) detected by RT‐qPCR. * p < 0.05 compared with adjacent normal tissues. (B) Expression of miR‐302a in glioma tissues (n = 45) and adjacent normal tissues (n = 45) detected by in situ hybridization (scale bar = 50 μm). (C) Expression of miR‐302a in cell lines HEB, U251, LN‐229, LN‐18 measured by RT‐qPCR. * p < 0.05 compared with human normal glial cell line HEB. (D) Expression of miR‐302a in cell line LN‐229 in response to OE‐JMJD1C or sh‐JMJD1C measured by RT‐qPCR. (E) JMJD1C enrichment in the promoter region of miR‐302a examined using ChIP assay. * p < 0.05 compared with cells treated with OE‐NC. (F) H3K9me1 enrichment in the promoter region of miR‐302a examined using ChIP assay. * p < 0.05 compared with cells treated with OE‐NC. The measurement data are expressed as mean ± SD. Comparison between glioma tissues and adjacent normal tissues is performed using paired t‐test, while comparison among multiple groups is conducted using one‐way ANOVA and Tukey's post hoc test. The cellular experiment is carried out at least three times independently
