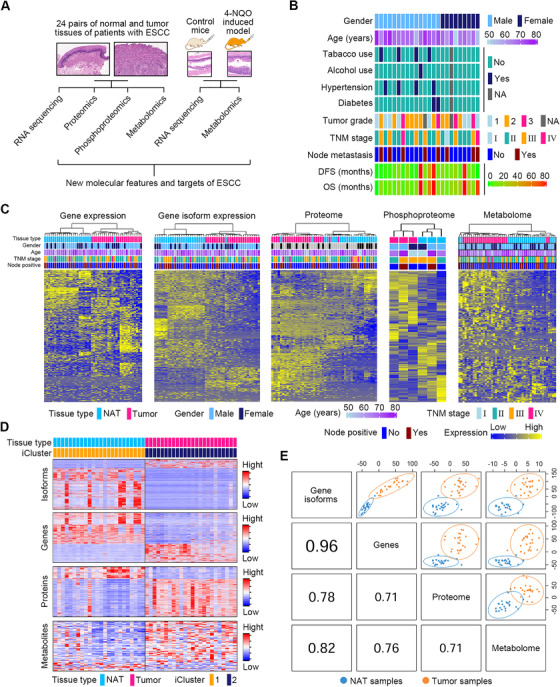
FIGURE 1.

Multilayer omics profiling of ESCC and NAT tissues. (A) Strategy of multilayer omics investigations using paired ESCC and NAT samples from patient cohort 1 (n = 24) along with esophageal tissues from control mice and carcinogen‐induced ESCC mice. (B) Heatmap showing clinical parameters of ESCC patients for multilayer omics investigations. (C) Unsupervised hierarchical clustering of multi‐omics data of ESCC patients. Clinical parameters from 48 tissue samples profiled with each omics data are also depicted. (D) Integrated clustering of four molecular layers of data showed that tissue samples of patients with ESCC fell into two groups by iCluster that were virtually identical to histological classes ESCC and NAT. (E) Correlation analysis between any two omics profiles using DIABLO algorithm
