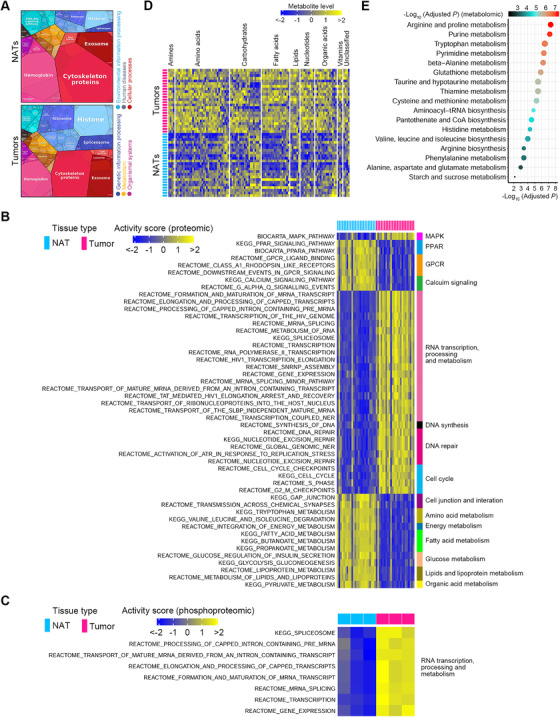
FIGURE 4.

Multi‐omics characterization of molecular features of ESCC. (A) Differential functional categories between NAT and ESCC specimens as illustrated by Proteomaps using proteomic data. Each polygon corresponds to a single KEGG pathway, and the size was correlated with the ratio between the two groups of samples. The maps show high dissimilarity between NAT and ESCC tissues. (B) Activity scores of the top 50 significantly perturbed pathways according to protein levels between ESCC and NAT tissues. Up‐ and downregulated pathways are shown as blue and yellow, respectively. (C) Activity scores of significantly disturbed pathways according to protein phosphorylation levels between ESCC and NAT tissues. Up‐ and downregulated pathways are indicated as blue and yellow, respectively. (D) Differentially expressed metabolites between ESCC tumors and NATs as exhibited by the heatmap. Notably, most of these metabolites were upregulated in ESCC tumors. (E) Significantly perturbed metabolic pathways in human ESCC. The node size represents the statistic q‐values of metabolic pathways derived from MSEA analysis
