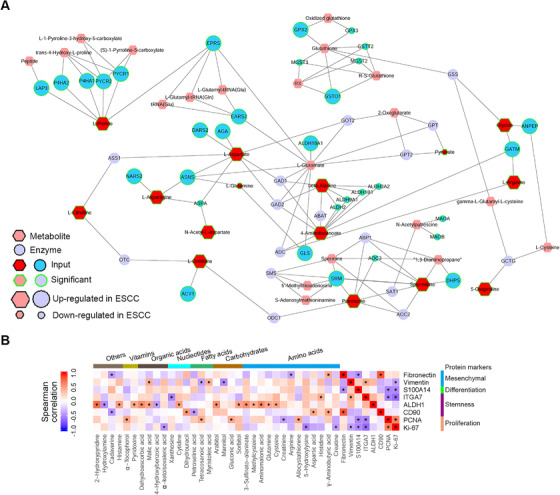
FIGURE 5.

Integrative analysis of molecular signatures of ESCC using proteomic and metabolomic data. (A) Integrative analysis of significantly altered metabolic enzymes and metabolites for the most perturbed metabolic pathway in ESCC, arginine and proline metabolism. (B) Spearman correlation analysis between DEMs and DEPs representing key cellular phenotypes of ESCC. Metabolites with significant correlation to at least one phenotypic protein marker are selected for display. Star marks in heatmap cells represent correlations between metabolites and proteins with p < .05
