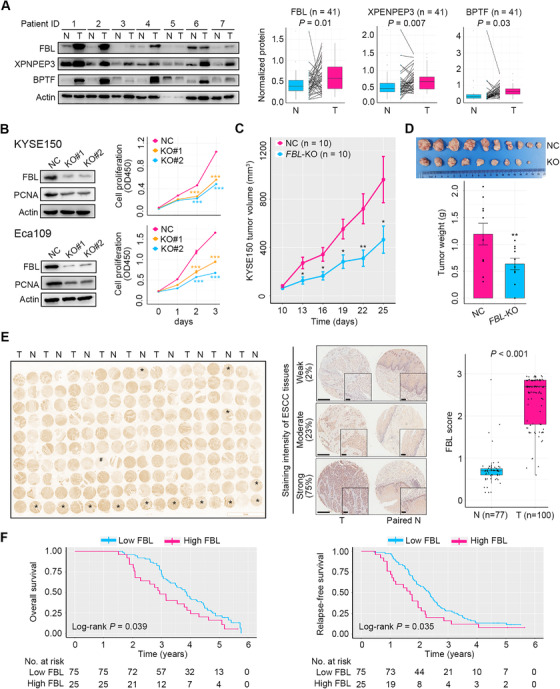
FIGURE 8.

Validation and functional assays of prognostic protein markers. (A) Validation of the expression of FBL, XPNPEP3, and BPTF between ESCC tumors and NATs using a patient cohort 2 (n = 41). Western blot and quantitative results displayed an increase in expression of these proteins in ESCC tumors (T) relative to NATs (N). Representative Western blot images are shown. p‐Values were computed using the Wilcoxon rank‐sum test. (B) Knockdown of FBL in ESCC cells KYSE150 and Eca109 and the consequential impact on PCNA expression and cell growth in vitro. (C) FBL ablation curtailed the growth of KYSE150 xenograft tumors (n = 10 for each group). (D) Images and weight of KYSE150 xenograft tumors with or without FBL deletion (n = 10 for each group). (E) Left panel, IHC staining image showing FBL expression between ESCC (T) and NAT (N) tissues from patient cohort 3 (n = 100). Samples in the microtissue array that are not orderly arranged are marked with stars for ESCC tissues or hashes for NATs. Middle panel, representative images of ESCC tissues with weak, moderate, or strong FBL staining. The percentage of tumor tissues of each staining intensity is revealed. Paired normal tissues are displayed. Right panel, quantification of IHC staining. p‐Value was obtained from the Wilcoxon rank‐sum test. (F) Overall survival and relapse‐free survival curves of ESCC patients of cohort 3 (n = 100) stratified by low and high FBL expressions from IHC staining. Error bars represent mean ± SEM. * p < .05, ** p < .01, *** p < .001, two‐tailed Student's t‐test
