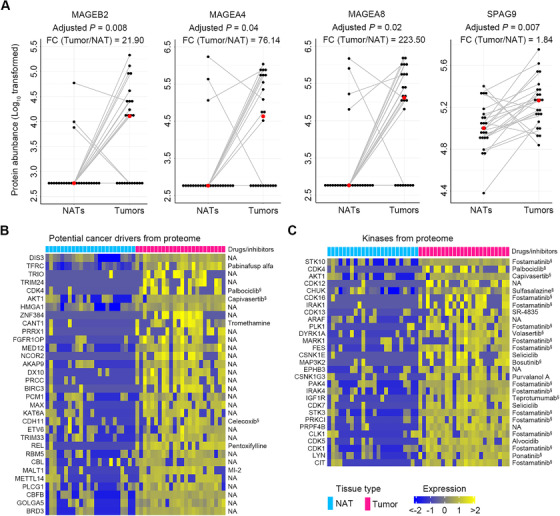
FIGURE 10.

Identification of tumor antigens and drug annotation of potential cancer drivers and key kinases in ESCC. (A) Four tumor antigens with significant increases in ESCC tumors were identified by comparison of our proteomic data to a cancer/testis antigen list downloaded from the CTDatabase. Red dots represent the median values of each group. p‐Values were computed using the Wilcoxon rank‐sum test with Bonferroni correction. (B) A total of 32 potential cancer drivers with more than four‐fold increase in ESCC tissues were identified by comparison of our proteomic data to a list of potential cancer drivers provided by a previous study. (C) A total of 29 kinases with more than four‐fold increase in ESCC tissues were discovered by comparison of our proteomic data to a kinase list from databases, PhosphoSitePlus and NetworKIN. Identified cancer drivers and key kinases were annotated with targeted drugs or inhibitors by searching the databases, DrugBank and PKIDB. §Drugs or inhibitors approved by Food and Drug Administration for clinical trial. NA, not available
