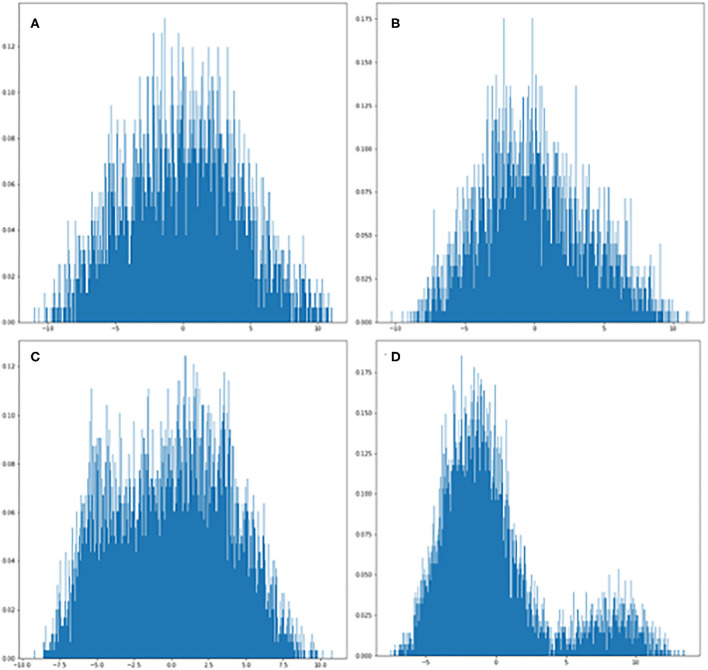
Figure 2.
PCA plots of GAN-generated images from each category. (A) Visualization of ischemic scar image set generated from PGGAN. (B) Visualization of control image set generated from PGGAN. (C) Visualization of ischemic scar image set generated from CycleGAN. (D) Visualization of control image set generated from CycleGAN.

