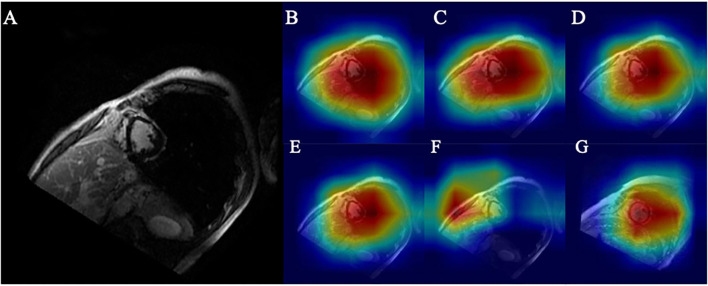
Figure 6.
(A) Original ischemic scar image. (B) Heatmap of base model. (C) Heatmap of CA embedded to base model. (D) Heatmap of CA embedded to base model with 4x traditional augmentation. (E) Heatmap of CA embedded to base model with 4x PGGAN augmentation. (F) Heatmap of CA embedded to base model with 4x CycleGAN augmentation. (G) Heatmap of CA embedded to base model with 4x traditional augmentation of image in the control group.

