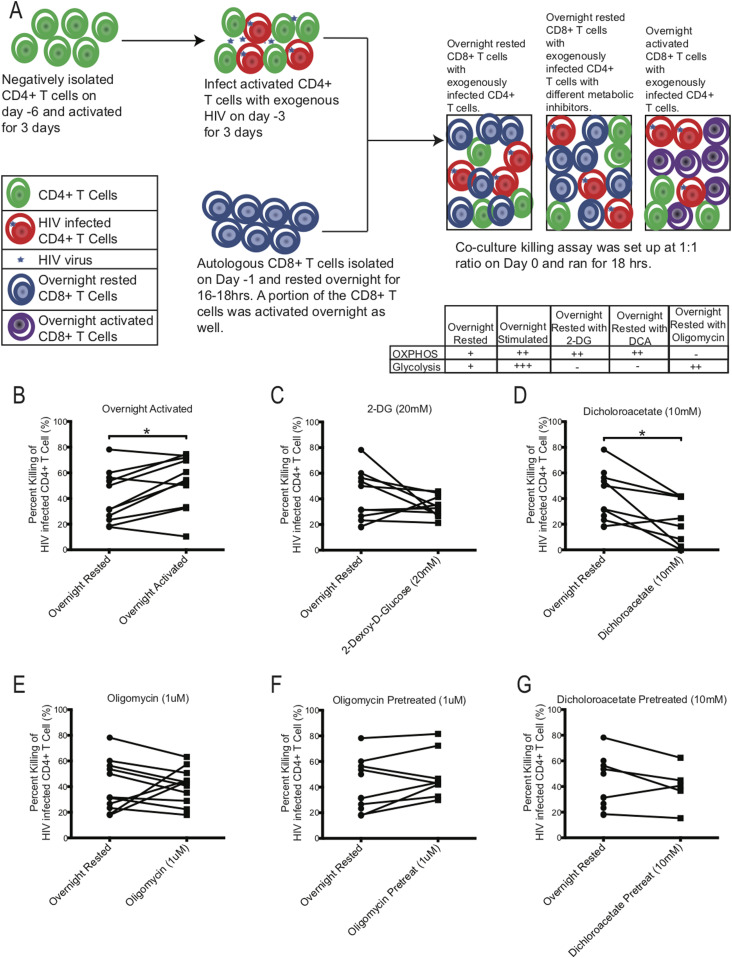
Figure 7. Effect of metabolic inhibitors on HIV-specific killing capacity of CD8+ T cells.
(A) Schematic of killing assay experimental setup. Table indicates proposed effect of inhibitors on metabolism. (B, C, D, E, F, G) The killing capacity of CD8+ T cells from overnight rested (n = 11) donors were compared against CD8+ T cells that were either: (B) activated overnight (n = 11) or (C) had 20 mM of 2-DG (n = 10) or (D) 10 mM of DCA (n = 8) or (E) 1 μM of oligomycin (n = 11) during killing assay, or (F) were pretreated with 1 μM of oligomycin (n = 8) or (G) 10 mM of DCA (n = 5) and washed before setting up the killing assay. * indicates P < 0.05 by unpaired two tailed nonparametric Mann–Whitney test.

