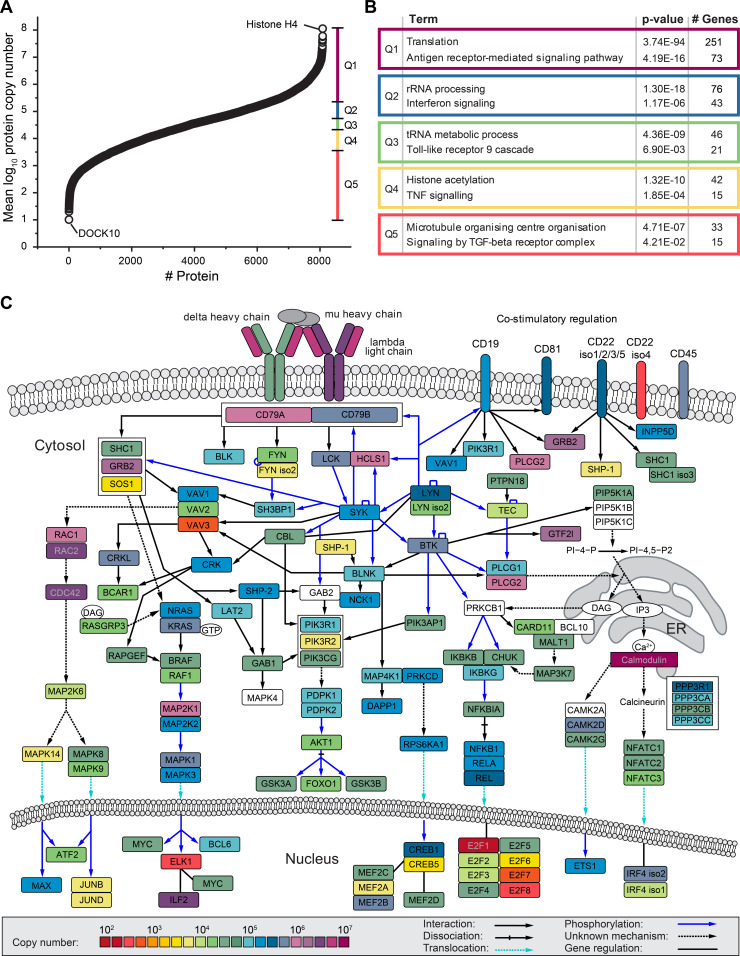
Figure 1. Global absolute quantification of protein expression in Ramos B cells.
(A) Ramos B cell protein copy number plot. Shown are the mean log10-transformed copy number values of 8,086 proteins. The dataset was divided into five equal-sized quantiles (Q1–Q5) according to copy number rank. (B) Gene ontology term enrichment analysis of proteins in Q1–Q5, as shown in (A), against the human proteome. For each quantile, significantly enriched processes of the Gene Ontology term “biological process” and the Reactome pathway are shown with Bonferroni step-down corrected P-values (n = 3) and the number of associated genes. (C) BCR downstream signaling network. The mean copy numbers of individual proteins per Ramos B cell (n = 3) are indicated by their color. The pathway was adapted from Satpathy et al (2015). See also Fig S1 and Table S1.

