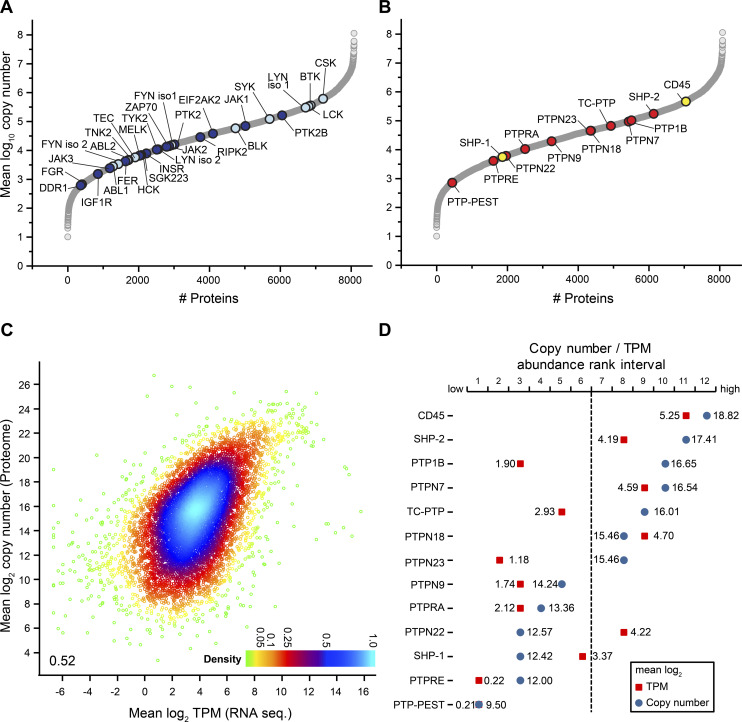
Figure 2. Evaluation of protein tyrosine kinases (PTKs) and classical protein tyrosine phosphatases (PTPs) in Ramos B cells at quantitative scale.
(A) Copy number profile of 28 different PTKs identified and quantified in Ramos B cells. Src family kinases and other PTKs known to be involved in BCR signaling are shown in light blue, all others in dark blue. (B) Copy number profile of the 13 classical PTPs identified and quantified in Ramos B cells. CD45 and SHP-1, known to be involved in BCR signaling are highlighted in yellow, the other classical PTPs in red. (C) Density plot comparing mean log2-transformed protein copy numbers of the Ramos B cell proteome analysis against transcript per million values of the RNA sequencing dataset. A Pearson correlation coefficient of 0.52 was calculated. TPM, transcripts per million. (D) Comparison of the abundance of classical PTPs shown in (B) according to protein (mean log10-transformed copy numbers, blue) and mRNA levels (mean log2 transcript per million values, red) of 7,944 proteins and transcripts, respectively. Mass spectrometric and RNA-sequencing datasets were divided into 12 equal-sized abundance rank intervals, with the least and most abundant 662 proteins/transcripts in interval 1 and 12, respectively.

