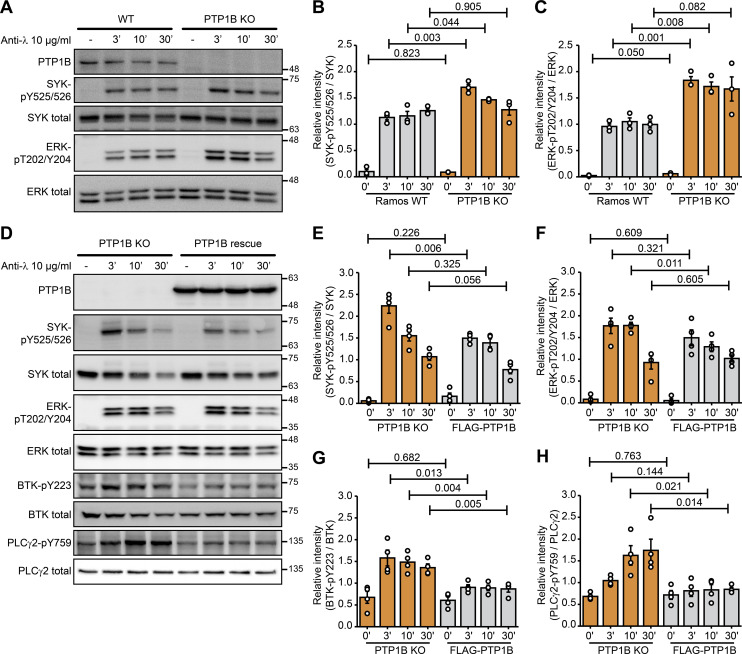
Figure 3. Loss of PTP1B leads to an increase in phosphorylation of SYK-Y525/526, ERK-T202/Y204, PLCγ2-Y759, and BTK-Y223 in Ramos B cells.
(A) Immunoblot analysis of SYK-Y525/526 and ERK-T202/Y204 phosphorylation in WT and PTP1B KO Ramos cells stimulated with anti-λ for the indicated time points. Representative immunoblots of three independent biological replicates are shown. (B, C) Quantification of immunoblot data of SYK-pY525/526 (B) and ERK-pT202/Y204 (C) shown in (A). Signal intensities were normalized to the respective total protein signals and a t test was performed (n = 3). Error bars represent the SEM. (D) Immunoblot analysis of PTP1B KO and FLAG-PTP1B induced (PTP1B rescue) Ramos cells stimulated with anti-λ for the indicated time points. Representative immunoblots of three independent biological replicates are shown. (E, F, G, H) Quantification of immunoblot data of SYK-pY525/526 (E), ERK-pT202/Y204 (F), BTK-pY223 (G), and PLCγ2-pY759 (H) shown in (D). Signal intensities were normalized to the respective total protein signals and a t test was performed (n = 4). Error bars represent the SEM.
Source data are available online for this figure.

