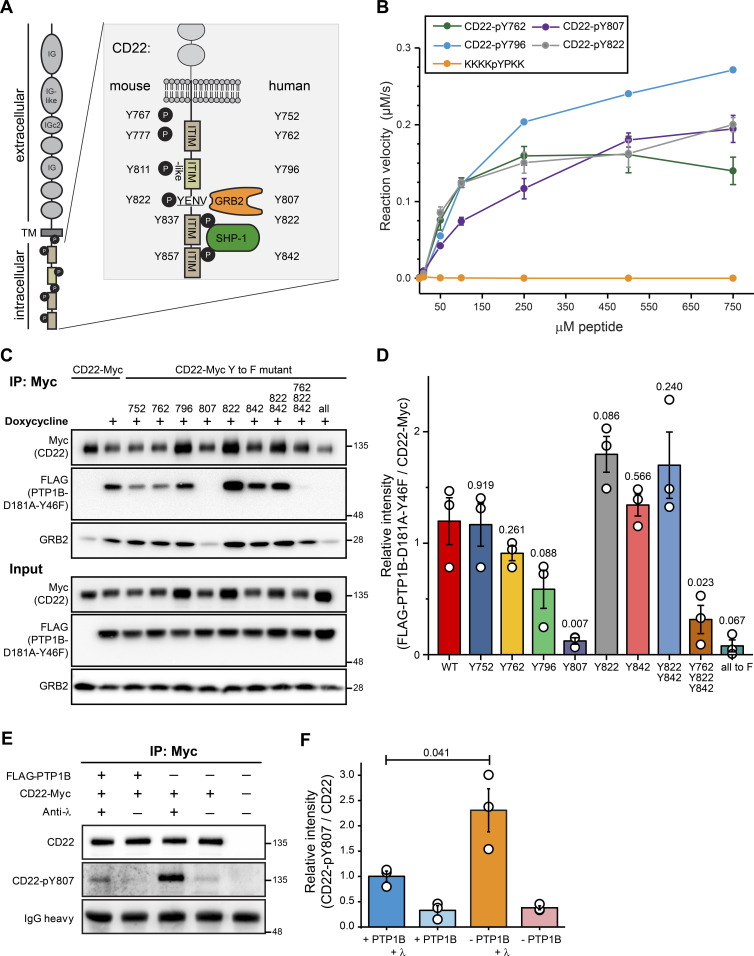
Figure 6. PTP1B dephosphorylates CD22 at pY807.
(A) Schematic representation of the human/mouse CD22 molecule with domain structure and intracellular tyrosine (Y) residues. ITIM, immunoreceptor tyrosine-based inhibitory motif; TM, transmembrane domain; IG, immunoglobulin domain; GRB2, growth factor receptor-bound protein 2; SYK, spleen tyrosine kinase. (B) Peptide-based phosphatase assay showing the dephosphorylation of four synthetic CD22 peptides by GST-tagged PTP1B. Error bars represent the standard deviation of three independent experiments. (C) PTP1B KO Ramos cells with inducible FLAG-PTP1B-D181A-Y46F trapping mutant were stably transduced with Myc-tagged CD22 WT or Myc-tagged CD22 site mutants in which single tyrosine residues were replaced by phenylalanine (Y-to-F mutants) as indicated. Following inducible expression of FLAG-PTP1B-D181A-Y46F, co-immunoprecipitations using anti-Myc antibody were performed and bound proteins were eluted (n = 3). CD22 WT and phosphosite mutants were detected in cell lysates and eluates by SDS–PAGE immunoblotting using anti-Myc antibody. The FLAG-tagged PTP1B trapping mutant was detected using anti-FLAG antibody. Co-immunoprecipitation of GRB2 was detected using a GRB2 antibody (n = 1). (D) Quantification of immunoblot data from (C). Anti-FLAG signals (FLAG-PTP1B-D181A-Y46F) were normalized to anti-myc signals (myc-tagged CD22 and site mutants thereof). A t test was performed testing each mutant against the control and P-values were calculated (n = 3). Error bars represent the SEM. (E) Phosphatase assay in FLAG-PTP1B-inducible Ramos cells. Myc-tagged CD22 was immunoprecipitated from untreated or anti-λ stimulated cells, with or without the expression of FLAG-PTP1B. Phosphorylation levels of CD22-Y807 were monitored by immunoblot. (F) Quantification of immunoblots from (E). CD22-pY807 signals were normalized to the signals for immunoprecipitated CD22-myc. A t test was performed and P-values were calculated (n = 3). Error bars represent the SEM.
Source data are available online for this figure.

