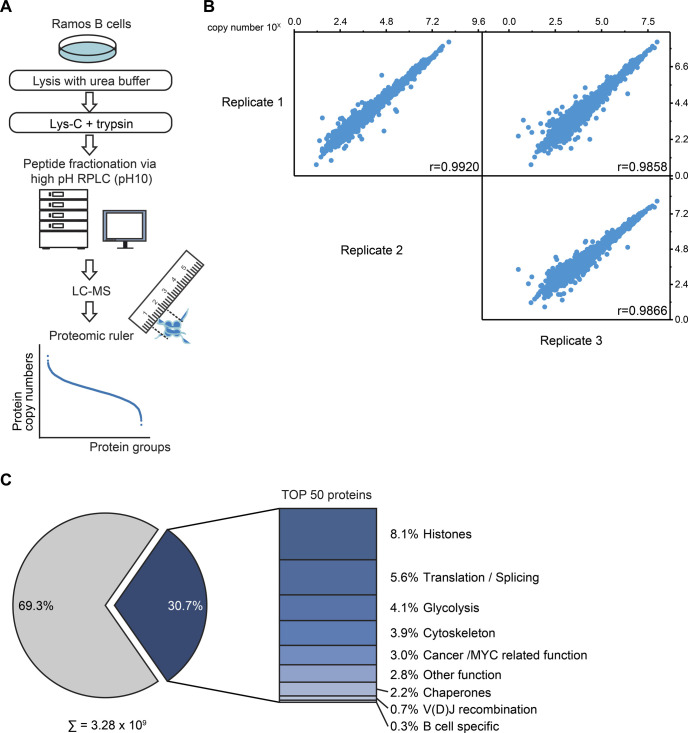
Figure S1. Absolute quantitative analysis of the Ramos B cell proteome.
Related to Fig 1. (A) Workflow of the global absolute quantitative proteome analysis. Ramos B cells were lysed in urea buffer and proteins digested in-solution using Lys-C and trypsin. Proteolytic digests were fractionated using high-pH reversed-phase liquid chromatography and analyzed by LC-MS. Copy numbers of proteins were calculated based on MS1 data from three independent biological replicates using the proteomic ruler method (Wiśniewski et al, 2014). (B) Multi-scatterplot depicting the correlation of the determined log10 copy number of proteins per Ramos B cell between individual replicates. Pearson’s correlation coefficient, r. (C) Piechart depicting the share of the 50 most abundant proteins on the total copy number per Ramos B cell. The bar chart shows the classification of these 50 proteins in different functional categories (see Table S1).

