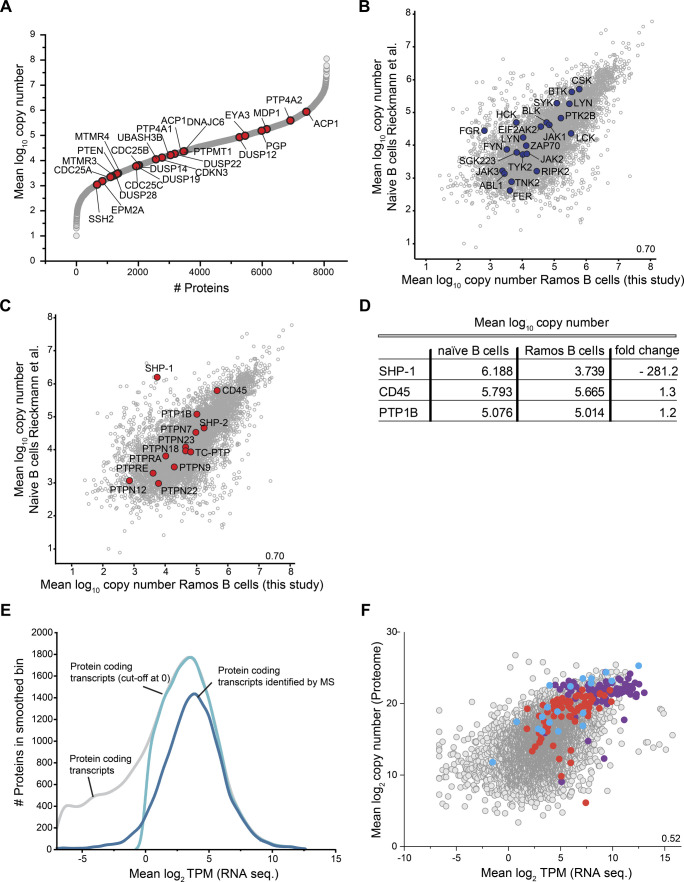
Figure S2. Evaluation of absolute quantitative proteome data of human Ramos B cells.
Related to Fig 2. (A) Protein copy number profile of protein tyrosine phosphatases (PTPs), without the “classical” PTPs shown in Fig 2B, identified in Ramos B cells. (B, C) Scatterplots comparing mean log10 protein copy numbers of naïve B cells (Rieckmann et al, 2017) and Ramos B cells reported in this study. Protein tyrosine kinases present in the dataset are depicted in blue (B) and “classical” PTPs in red (C). (D) Mean log10 copy numbers of the three most abundant “classical” PTPs in naïve B cells compared to Ramos B cells and the difference in expression given as fold-change. (E) Kernel-smoothed distribution curves of RNA sequencing (seq) data of human Ramos B cells calculated from raw data reported in Qian et al (2014). Grey, distribution of transcripts of protein-coding genes; light blue, distribution of transcripts of protein-coding genes with a mean log2 transcript per million value > 0; dark blue, protein-coding transcripts for which proteins were identified by MS analysis in this work (see Figs 1 and S1 and Table S1). (F) Comparison of log2-transformed mean transcript per million values and protein copy numbers of ribosomal proteins (purple), proteasome components (red), and enzymes of canonical glycolysis (blue).

