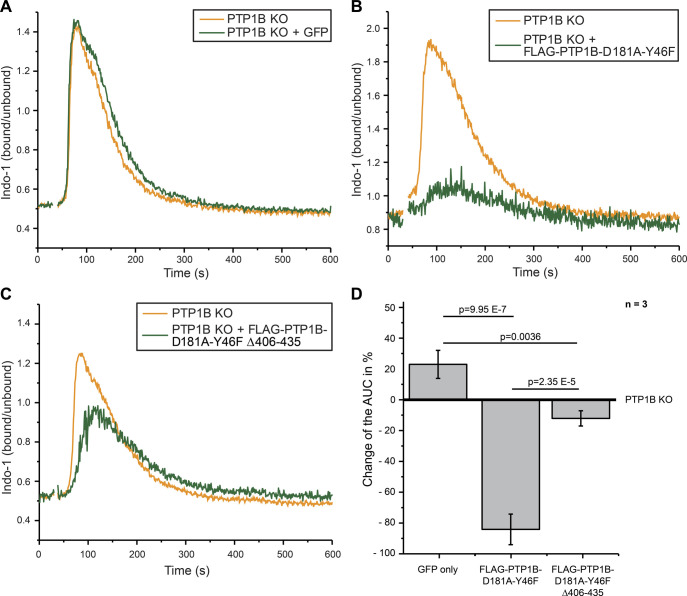
Figure S6. PTP1B trapping mutants capture proteins involved in calcium signaling.
Related to Fig 5. (A, B, C) Intracellular calcium mobilization after anti-λ stimulation (1 μg/ml) in PTP1B knockout cells with inducible expression of empty vector control (GFP only) (A), FLAG-PTP1B-D181A-Y46F (B) or FLAG-PTP1B-D181A-Y46F Δ406-435 (C) substrate trapping mutants. (D) Quantification of the calcium response by the determination of the baseline-corrected area under the curve of the calcium kinetics. Statistical analysis was performed using a t test (two-sided, n = 3, error bars = SEM). AUC, area under the curve.

