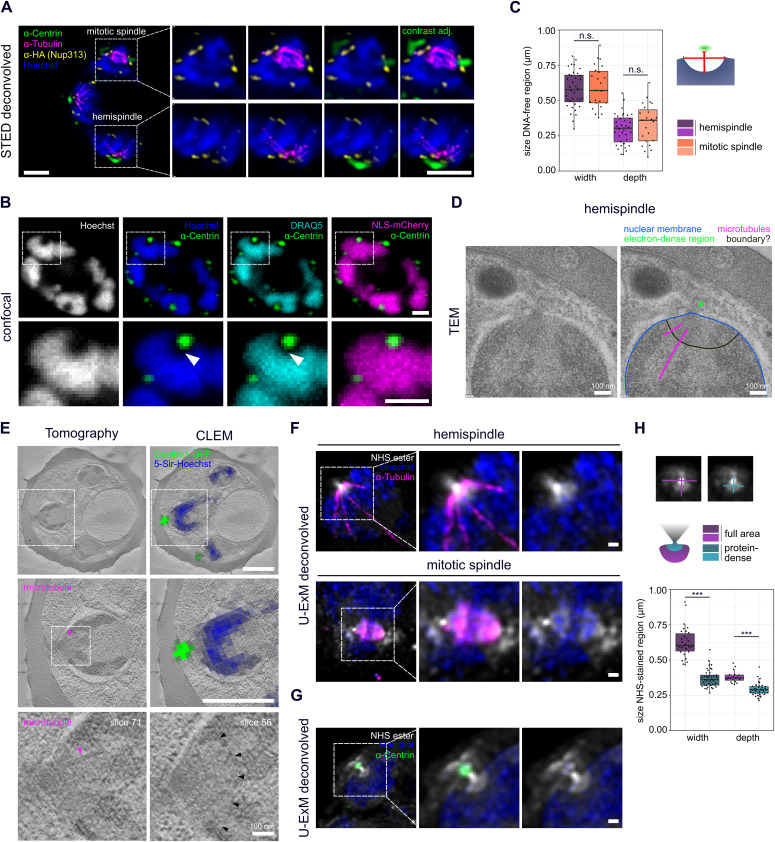
Figure 3. Centriolar plaques are divided in an extranuclear centrin-containing compartment and an intranuclear DNA-free and protein-dense compartment associated with microtubules.
(A) Dual-color STED nanoscopy images of a 3D7 schizont expressing tagged nuclear pore protein Nup313-3xHA_glms, labeled with anti-HA (yellow), anti-tubulin (magenta), and overlayed with confocal images of anti-centrin (green) and Hoechst staining (blue). (B) Confocal images of a 3D7 schizont ectopically expressing 3xNLS-mCherry. Signal was enhanced with RFP-Booster-Atto594 (magenta) and cells labeled with anti-centrin (green) and with Hoechst (blue) and DRAQ5 (turquoise) to detect DNA. (C) Quantification of dimensions of the DNA-free region in 3D7wt hemispindle (n = 36) and mitotic spindle (n = 23) stages using single image slices acquired in one immunofluorescence staining. Dimensions were measured as indicated in schematic. Depth was measured from underneath the centrin signal to the deepest point of the DNA-free region. Width was measured at the widest diameter of the DNA-free region where the nuclear membrane is expected. (D) Transmission EM image of the centriolar plaque region (annotated copy on the right) in a NF54 wt schizont shows no invagination of the nuclear membrane (blue) but suggests a boundary-like structure (black) delineating an intranuclear region from which microtubules (magenta) emanate. Green arrow indicates electron-dense region likely associated with the centriolar plaque. (E) Correlative in-resin widefield fluorescence and electron tomography (CLEM) images of thick sections (300 nm) of a high-pressure frozen and embedded NF54 schizont expressing PfCentrin1-GFP (green) and stained for DNA with 5-SiR-Hoechst (blue). Same cell region containing clear PfCentrin1-GFP foci imaged by fluorescence microscopy was overlayed with an electron tomogram slice. In zoom-ins, arrows indicate a microtubule (magenta) and a boundary-like region (black) for two tomogram slices. (F) Confocal images of individual 3D7 Nup313-3xHA_glms schizont nuclei expanded with U-ExM in hemispindle and mitotic spindle phase. Proteins were labeled in bulk using an NHS-ester Atto594 dye conjugate (white). Brighter staining therefore indicates higher protein density. Cells were additionally stained with anti-tubulin (magenta) and Hoechst (blue). (G) as in (F), but cells were labeled with anti-centrin (green) instead of anti-tubulin. (H) Quantification of width and depth of the NHS conjugate-stained intranuclear region at the centriolar plaque for the full area as well as the highly protein-dense region as example image and schematic indicate. To test for significant differences, we used the Mann–Whitney U test. In total, we analyzed NHS-stained regions of 14 schizonts (one replicate).

