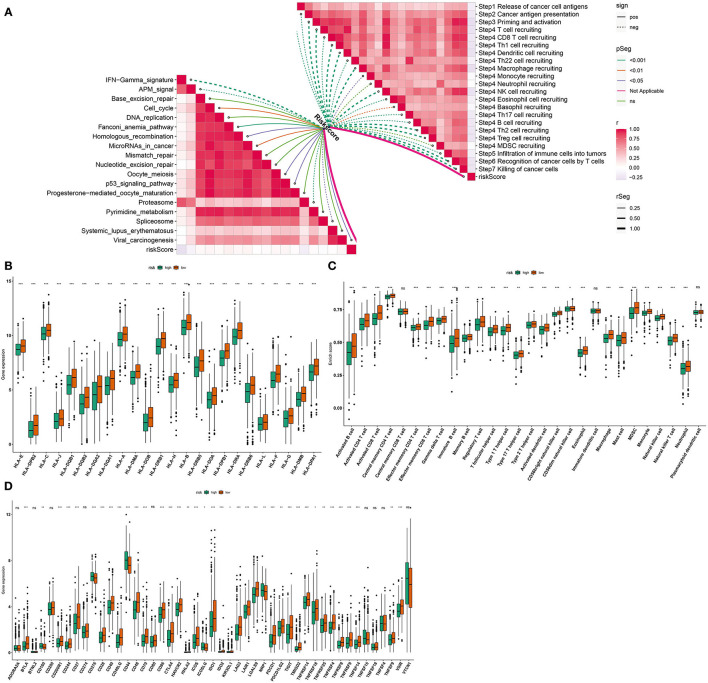
Figure 6.
Associations between the pyroptosis-related gene signature and immunogenicity of breast cancer. (A) Correlations between risk score and cancer immunity cycle and pathways. Dotted line indicates negative correlation and solid line indicates positive correlation. The darker the color, the stronger the correlation. (B) Box plots were plotted for HLA expression in high- and low-risk samples. (C) Box plots were depicted to show infiltration levels of immune cells in high- and low-risk samples. (D) Box plots were utilized for visualizing expression of immune checkpoints in high- and low-risk samples. Ns: not significant;*p < 0.05; **p < 0.01; ***p < 0.001 that were derived from adjusted p-values.

