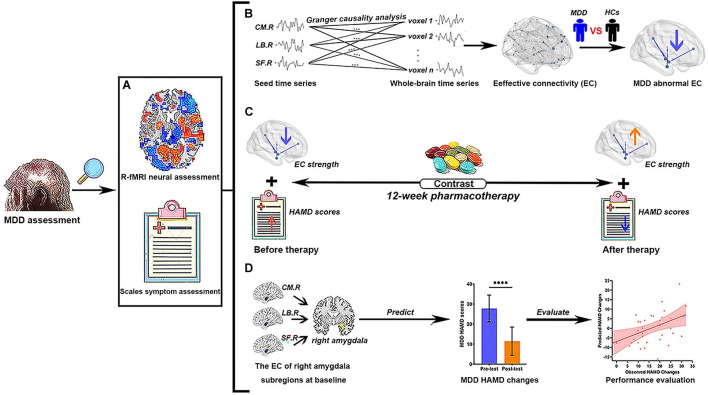
FIGURE 1.
Study flowchart of current research. (A) Two different MDD assessment methods were used in the present study. (B) The EC analysis of right amygdala subregions using Granger causality analysis. We explore abnormal right amygdala subregion-based EC in MDD patients by the comparison of R-fMRI data between MDD and HCs. (C) The contrast of the variance of EC strength and the changes of HAMD scores of MDD patients before and after pharmacotherapy, respectively. (D) The voxel-wise EC strength of right amygdala subregions at baseline is taken as feature sets to predict the changes of HAMD scores in MDD patients. The Spearman’s rank correlation between predicted HAMD scores changes and observed HAMD scores changes is used to evaluate the prediction power of current predictors. MDD, major depressive disorder; HC, healthy controls; R-fMRI, resting-state functional magnetic resonance imaging; CM, centromedial amygdala; LB, basolateral amygdala; SF, superficial amygdala; EC, effective connectivity; HAMD, 24-item Hamilton Rating Scale for Depression; L, left hemisphere; R, right hemisphere. Different color arrows indicate the change direction of studied indicators compared with the previous stage: cool colors indicate decrease and warm colors indicate increase. ****p < 0.0001.

