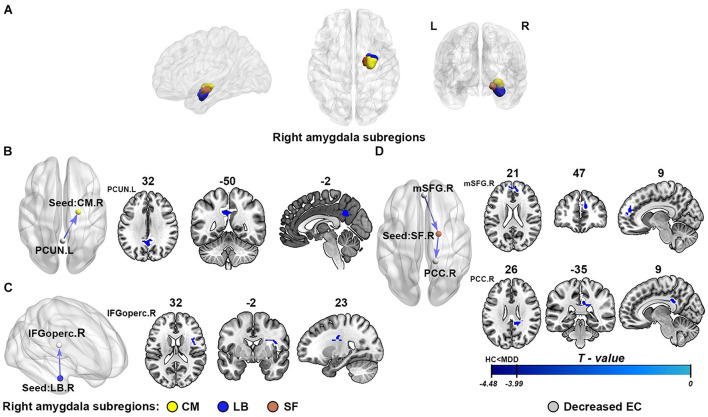
FIGURE 2.
The results of effective connectivity analysis of right amygdala subregions. (A) The subregions of the right amygdala: the centromedial amygdala (CM; yellow), laterobasal amygdala (LB; purple), and superficial amygdala (SF; red). (B–D) Represent the illustration of the abnormal effective connectivity of MDD in three different right amygdala subregions, respectively: CM, LB, and SF. The cool color arrows indicate significant decreased information flow of target brain regions in MDD. The gray indicates the specific abnormal brain regions, and the yellow/purple/red represents right CM/LB/SF, respectively. EC, effective connectivity; CM, centromedial amygdala; LB, basolateral amygdala; SF, superficial amygdala; PCUN, precuneus; IFGoperc, opercular part of inferior frontal gyrus; mSFG, medial superior frontal gyrus; PCC, posterior cingulate cortex; L, left hemisphere; R, right hemisphere.

