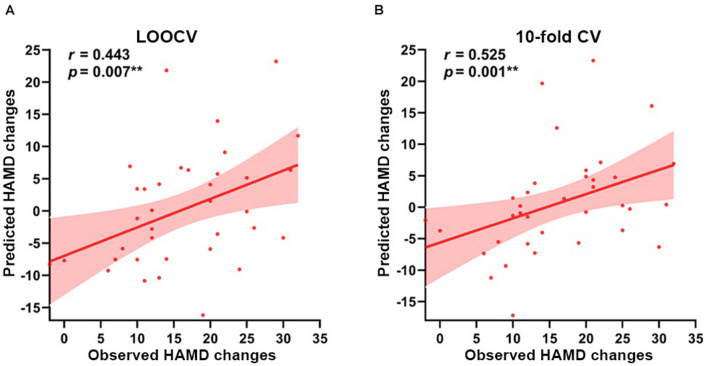
FIGURE 4.
Prediction results based on the EC of right amygdala subregions at baseline for symptom improvement. Scatter plots show the Spearman’s rank correlations between the observed HAMD scores changes and predicted HAMD scores changes of all participants in (A) LOOCV: r = 0.443, permutation p = 0.007, and (B) 10-fold CV: r = 0.525, permutation p = 0.001, respectively. **p < 0.01. LOOCV, Leave-one-out cross-validation; 10-fold CV, 10-fold cross-validation; HAMD, 24-item Hamilton Rating Scale for Depression.

