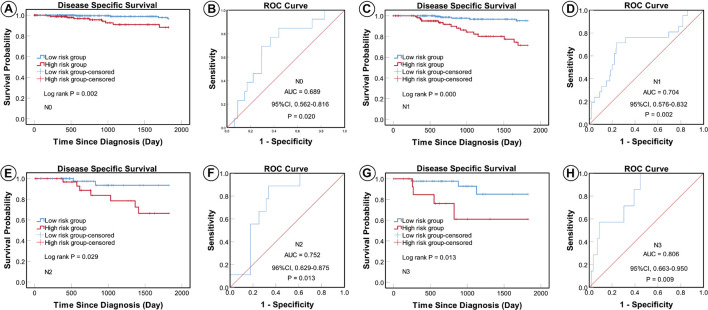
FIGURE 5.
KM and ROC curves for patients stratified by lymph node status. KM analysis showed that patients in the low-risk group had significantly better DSS in the N0 (A), N1 (C), N2 (E), and N3 (G) subgroups. ROC analysis showed that the five-miRNA signature exhibited high sensitivity and specificity in predicting the prognosis of patients with BC in the N0 (B), N1 (D), N2 (F), and N3 (H) subgroups.

