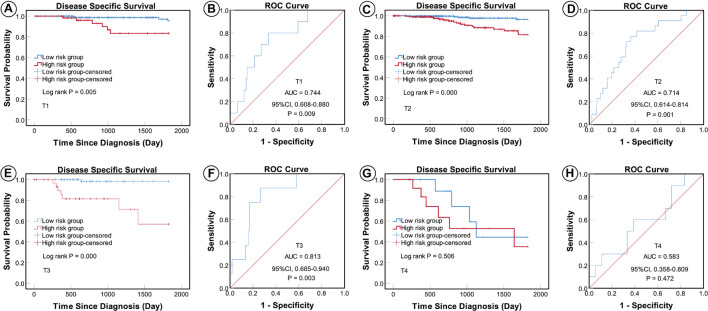
FIGURE 6.
KM and ROC curves for patients stratified by tumor size. KM analysis showed that the patients in the low-risk group had significantly better DSS in the T1 (A), T2 (C), and T3 (E) subgroups, but not in the T4 (G) subgroup. ROC analysis showed that the five-miRNA signature exhibited high sensitivity and specificity in predicting the prognosis of patients with BC in the T1 (B), T2 (D), and T3 (F) subgroups, but not in the T4 (H) subgroup.

