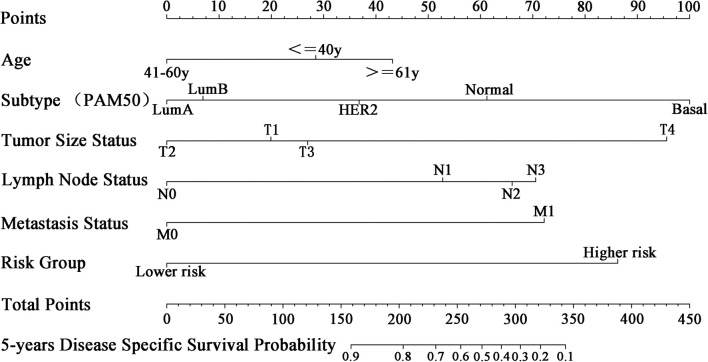
FIGURE 9.
Nomogram for predicting 5-year DSS of patients with BC. Each clinical predictive factor corresponds to a designated point shown by a line drawn perpendicular to the point’s axis. The corresponding sum of risk factor points, shown as total points, can be used to estimate the probability of 5-year DSS by drawing a line straight down to the 5-year DSS axis.

