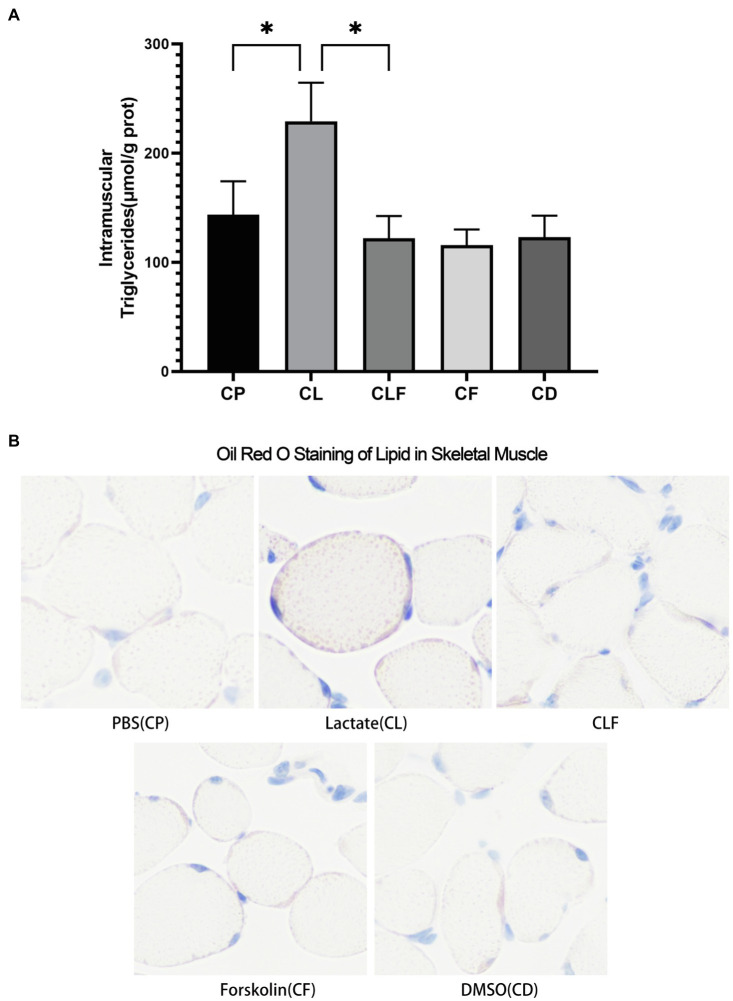
Figure 5.
Intramuscular triglyceride variation after chronic administration. (A) Intramuscular Triglycerides Abundance of Skeletal Muscle (n=6). (B) The Oil Red O Staining of gastrocnemius of mice (n=5). CP, chronic PBS treated group; CL, chronic lactate treated group; CF, chronic forskolin treated group; CD, chronic DMSO treated group; and CLF, chronic lactate and forskolin treated group. Other images can be found in the additional materials. Measurement data were expressed by mean±SD, and significant differences among the groups were analyzed with one-way ANOVA. * p<0.05.

