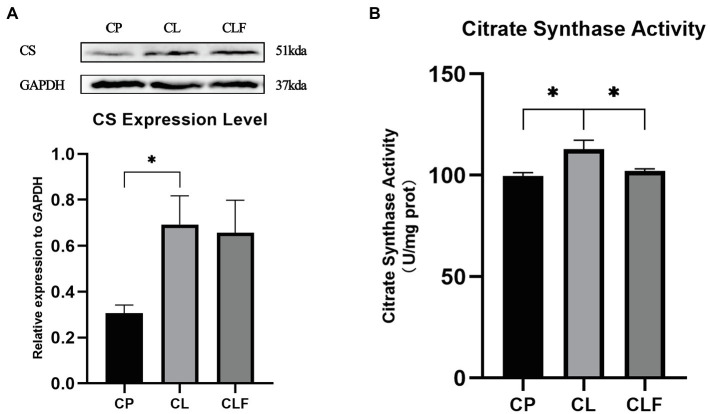
Figure 8.
The activity and expression level of citrate synthase (CS). (A) The expression level of CS in gastrocnemius after chronic administration (n=8). (B) The activity of CS after chronic administration. CP, chronic PBS treated group; CL, chronic lactate treated group; and CF, chronic forskolin treated group. Relative expression levels were normalized to GAPDH. Three bands are used for statistics. The data are presented as the mean±SD, and significant differences among the groups were analyzed with one-way ANOVA. * p<0.05.

