FIGURE 3.
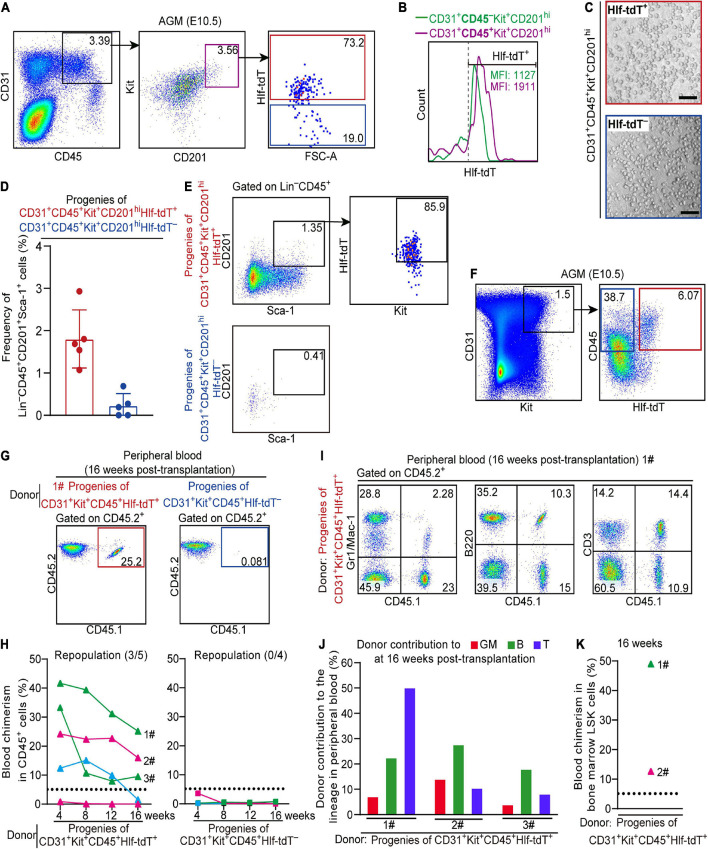
Hlf-tdTomato enriches functional CD45+ pre-HSCs in the E10.5 AGM region. (A) Representative FACS plots showing the proportion of Hlf-tdTomato+ and Hlf-tdTomato– cells in the CD31+CD45+Kit+CD201hi population in the AGM region of E10.5 Hlf-tdTomato embryos. Data are representative of five independent experiments. (B) Representative FACS histogram showing the fluorescence intensity of tdTomato in the CD31+CD45–Kit+CD201hi and CD31+CD45+Kit+CD201hi populations in the AGM region of E10.5 Hlf-tdTomato embryos. Values of mean fluorescence intensity of tdTomato in the Hlf-tdTomato+ cells are indicated. Data are representative of five independent experiments. (C) Representative morphology of hematopoietic cells generated from Hlf-tdTomato+ cells and Hlf-tdTomato– cells within the CD31+CD45+Kit+CD201hi population. Scale bar, 100 μm. (D) Graph showing the frequency of Lin–CD45+CD201+Sca-1+ cells generated from the indicated populations from the E10.5 AGM region after co-culture measured by FACS analysis. Data are shown as means ± SEM from five independent experiments. (E) Representative FACS plots showing the expression of Hlf-tdTomato and Kit in Lin–CD45+CD201+Sca-1+ cells that are generated from the indicated populations of the E10.5 AGM region after co-culture. Data are representative of five independent experiments. (F) Cell sorting strategy for the populations from the AGM region of E10.5 Hlf-tdTomato embryos for co-culture/transplantation assay. The cell populations sorted for functional assay are denoted by colored boxes. (G) Representative FACS plots of blood chimerism of donor-derived (CD45.1+CD45.2+) cells in CD45+ cells at 16 weeks post-transplantation. (H) Graphs showing the blood chimerism in CD45+ cells of each of all the recipients from 4 to 16 weeks post-transplantation. The recipients were transplanted with the culture products of CD31+Kit+CD45+Hlf-tdTomato+ (triangle, left) or CD31+Kit+CD45+Hlf-tdTomato– (square, right) cells from the AGM region of E10.5 Hlf-tdTomato embryos. Numbers of repopulated/total recipients are shown in the brackets. For each transplantation assay, cells from a total of 15 Hlf-tdTomato positive embryos belonging to three independent litters (biological repeats) were sampled and cultured as donor cells, and five recipients were used. Each line represents a recipient and each color represents an independent litter (biological repeat). (I) Representative FACS plots showing proportions of donor cells and each hematopoietic lineage at 16 weeks post-transplantation. Myeloid cells (Gr1/Mac-1+), B cells (B220+), and T cells (CD3+) in peripheral blood are shown. (J) Bar plot showing the percentages of donor contribution to granulocytes/monocytes (GM, red), B cells (green), and T cells (blue) in the peripheral blood at 16 weeks post-transplantation. (K) Graph showing donor contribution to the bone marrow hematopoietic stem progenitor cells (Lin–Sca-1+Kit+, LSK) of two successfully repopulated recipients at 16 weeks post-transplantation.
Next, Hlf-tdTomato+ and Hlf-tdTomato– cells within the CD31+Kit+CD45+ population from the E10.5 AGM region were, respectively, isolated and co-cultured with OP9-DL1 for 6 days, then transplantation assay was performed with the culture products. Of note, multi-lineage repopulation in peripheral blood and multiple organs (BM, spleen, and thymus) at 16 weeks post-transplantation was only detected in the recipients of Hlf-tdTomato+ group, consistent with the detection of the chimerism in the immunophenotypic HSCs and hematopoietic progenitors in BM (Figures 3F–K and Supplementary Figures 3C,D). Therefore, Hlf-tdTomato expression further enriched the HSC-competence in E10.5 CD45+ population. The finding also indicated that if a cell expresses CD45 prior to Hlf at this early stage, it has lost the possibility of specification toward HSCs.

