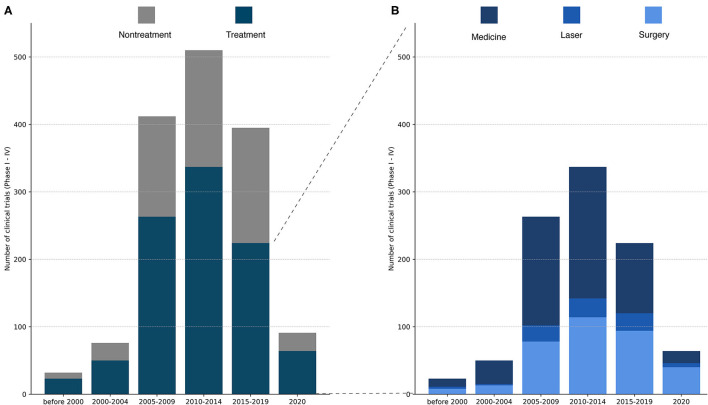
Figure 1.
(A) Total number of registered glaucoma clinical trials (Phase I–IV) over time. Each study was categorized as treatment or non-treatment. The number of clinical trials increased dramatically from 2000–2004 to 2005–2009, peaking in 2010–2014 and declining in 2025–2019. Of important note, the last column contains only trials from 2020, while the other columns cover a period of at least 4 years. (B) Total number of registered clinical trials in the treatment group divided into medical treatment, laser treatment or surgical treatment. Medical treatments constitute the majority of the assessed glaucoma treatments except from 2020, where surgery was the most frequently evaluated treatment in glaucoma trials.

