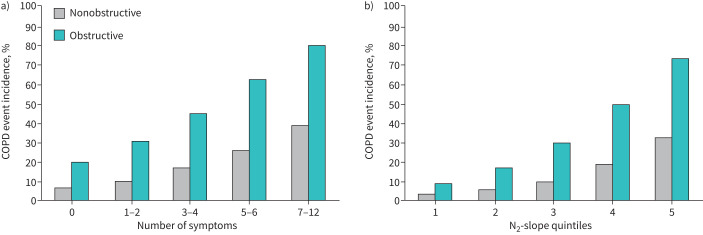
FIGURE 2.
a) Incidence of first admission to hospital or death related to COPD (COPD event incidence) in nonobstructive and obstructive subjects according to symptom groups where the numbers along the horizontal axis represent number of reported respiratory symptoms. b) The same incidence of admission to hospital or death related to COPD according to alveolar N2-slope quintiles. Number of subjects reporting symptoms among nonobstructive subjects were: 0 n=232, 1–2 n=168, 3–4 n=68, 5–6 n=36, 7–12 n=28. The corresponding numbers among obstructive subjects were: 0 n=22, 1–2 n=19, 3–4 n=16, 5–6 n=10, 7–12 n=20.

