FIGURE 3.
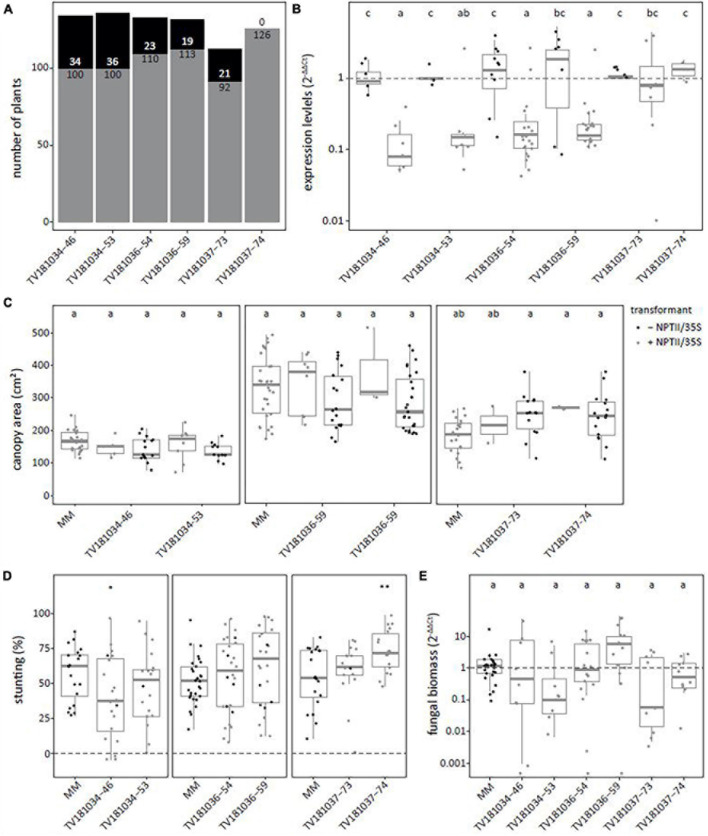
Loss of susceptibility to V. dahliae was not confirmed in all SlWAT1 T3 RNAi families. (A) Total number of plants with (gray) and without (black) the silencing construct for six T3 RNAi families which were obtained from three different T2 RNAi families. (B) Expression levels of T3 SlWAT1 RNAi families relative to plants without the silencing construct (– NPTII/35S, gray) and normalized using 2–ΔΔCt to SlEF1α with n ≥ 4 per family with (gray) and without (black) the silencing construct (ANOVA with Fisher’s unprotected LDS with p = 0.05 on ΔCt values). (C) Canopy area (cm2) of mock-inoculated plants at 21 days post inoculation (dpi) for T3 SlWAT1 RNAi families with (gray) and without (black) the silencing construct. Data from two independent experiments with n ≥ 2 (ANOVA with Fisher’s unprotected LSD, p = 0.05). (D) Stunting (%) of V. dahliae-inoculated plants when compared with the average stunting of mock-inoculated plants per genotype at 21 dpi. Box plots represent data with n ≥ 8 plants per experimental repeat (t-test when compared with MM with *p < 0.05 and **p < 0.01). (E) Relative fungal biomass in the stems of RNAi plants at 21 dpi with V. dahliae. This was calculated as the ratio of the V. dahliae ITS gene amplification in comparison with the tomato SlRUB gene (Supplementary Table 1) and normalized the V. dahliae-inoculated MM plants using 2–ΔΔCt on a log10 scale with n ≥ 7 per family (ANOVA with Fisher’s unprotected LSD, p = 0.05 on ΔCt). a–c: Genotypes having average values with a letter in common are not statistically significant different (at P = 0.05).

