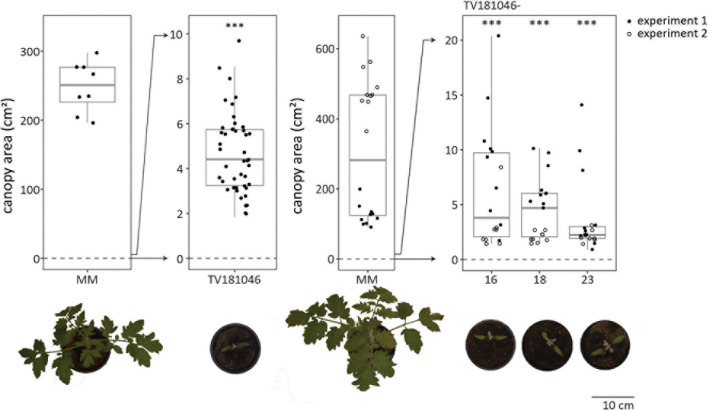
FIGURE 5.
CRISPR T2 family TV181046 and its T3 progeny display severe growth and development defects. Canopy area of mock-inoculated plants at 21 dpi for T2 CRISPR line TV181046 (left) and T3 CRISPR lines TV181046-16, –18, and –23 (right). Data from one or two independent experiments with n ≥ 8 (t-test compared with MM with ∗∗∗p = 0.001).

