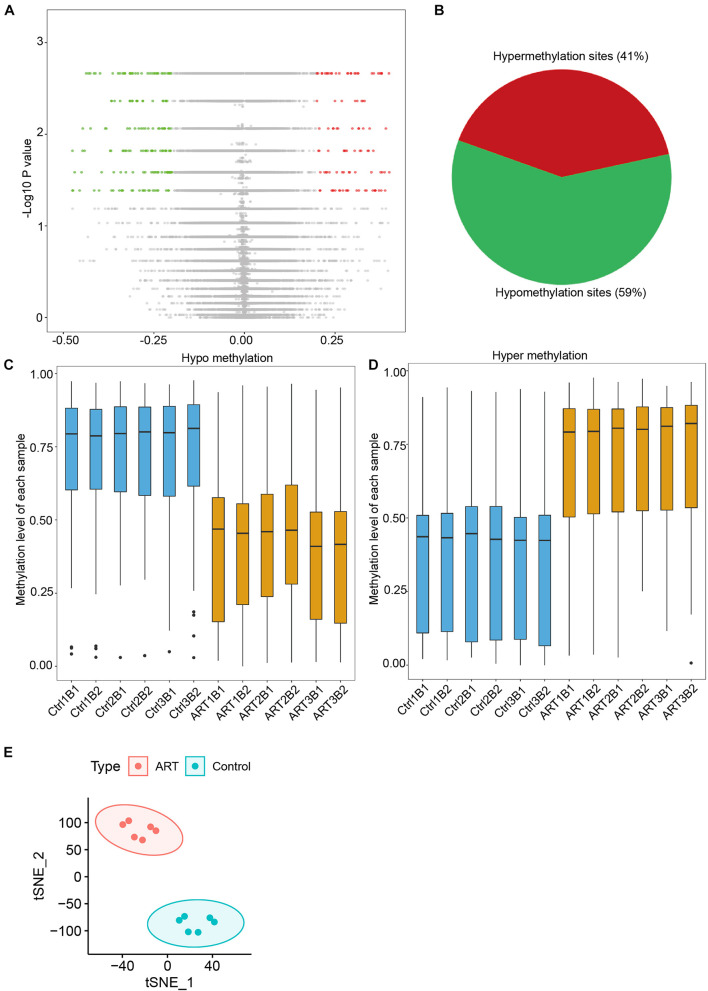
FIGURE 2.
Differential methylation analysis showed that the number of hypomethylation sites in ART-conceived infants was significantly higher than the number of hypermethylation sites. (A) Distribution of differences in DNA methylation levels between the two groups of infants. (B) The ratio of sites with hypomethylation differences and hypermethylation differences was 59:41. Distribution of methylation levels at different sites of hypomethylation (C) and hypermethylation (D). (E) tSNE analysis of differentially methylated sites (DMSs).

