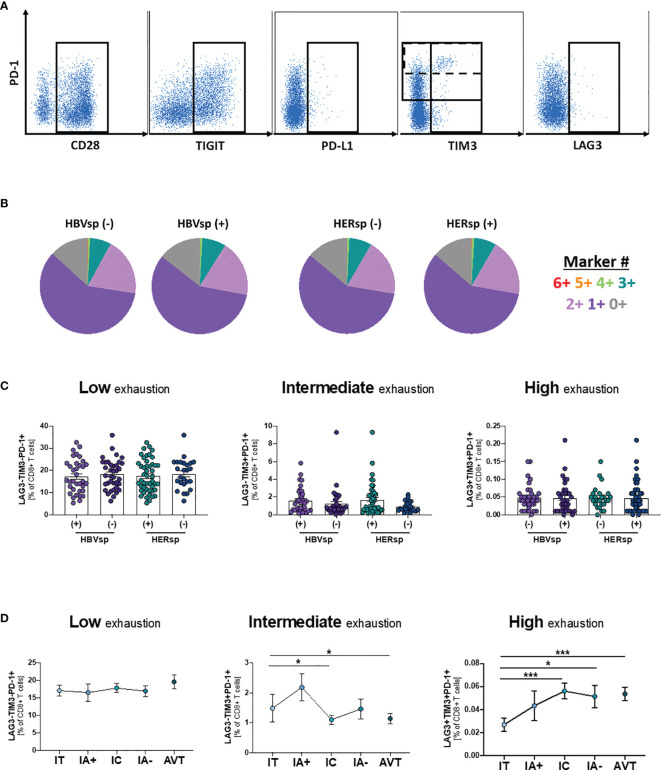
Figure 2.
Ex-vivo Ag-specific reactivity does not associate with bulk CD8 T cell exhaustion levels. (A) Representative flow plots showing expression levels, on bulk CD8 T cells, of inhibitory (iR) and activating (aR) receptors included in the SPICE analysis. (B) SPICE analysis showing the distribution of marker co-expression (6+ markers for CD28+PD-1+TIGIT+PD-L1+TIM3+LAG3+) among patients with either HBV-specific reactivity (core and/or pool, left panel) or HERPES-specific reactivity (CMV and/or EBV, right panel). Frequency of CD8 T cells with phenotype consistent with low exhaustion (LAG3-TIM3-PD-1+, left panel), intermediate exhaustion (LAG3-TIM3+PD-1+, middle panel) or high exhaustion (LAG3+TIM3+PD-1+, right panel) (C) among patients with either HBV-specific reactivity (core and/or pool) or HERPES-specific reactivity (CMV and/or EBV) and (D) among the different clinical groups. IT, Immune Tolerant; IA+, HBeAg+ Immune Active; IC, Immune Control; IA-, HBeAg- Immune Active; AVT, Anti-Viral Therapy. *p < 0.05; ***p < 0.001.

