
Figure 4.
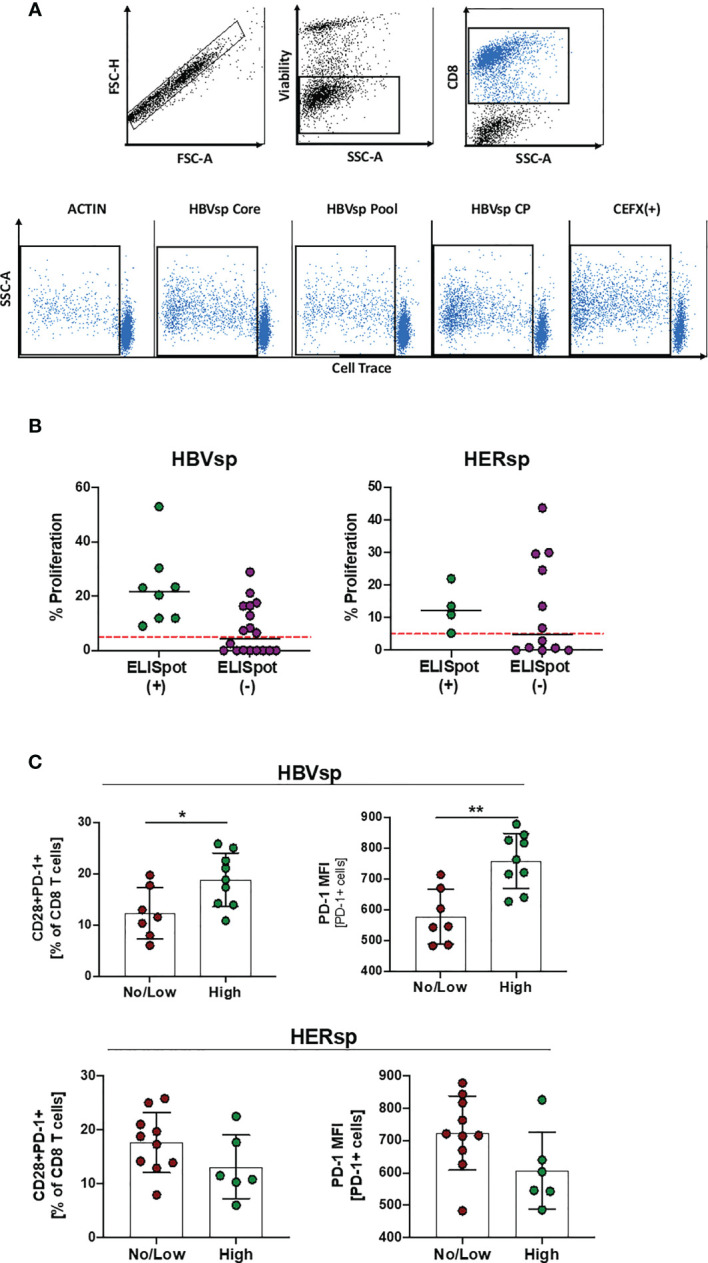
T cell expansion unveils Ag-specific T cells in ex vivo not-reactive samples. (A) Representative flow plots showing the gating strategy for the cell trace dilution assay. (B) Frequency of CD8 proliferating cells among reactive and non-reactive samples for both HBV-specific (core and/or pool) and HERPES-specific (CMV and/or EBV) assays. (C) Baseline frequency of CD28+PD-1+ CD8 T cells and the mean fluorescence intensity (MFI) of the PD-1 marker on CD8 T cells among samples with low or high proliferation levels. *p < 0.05; **p < 0.001; Mann Whitney U.