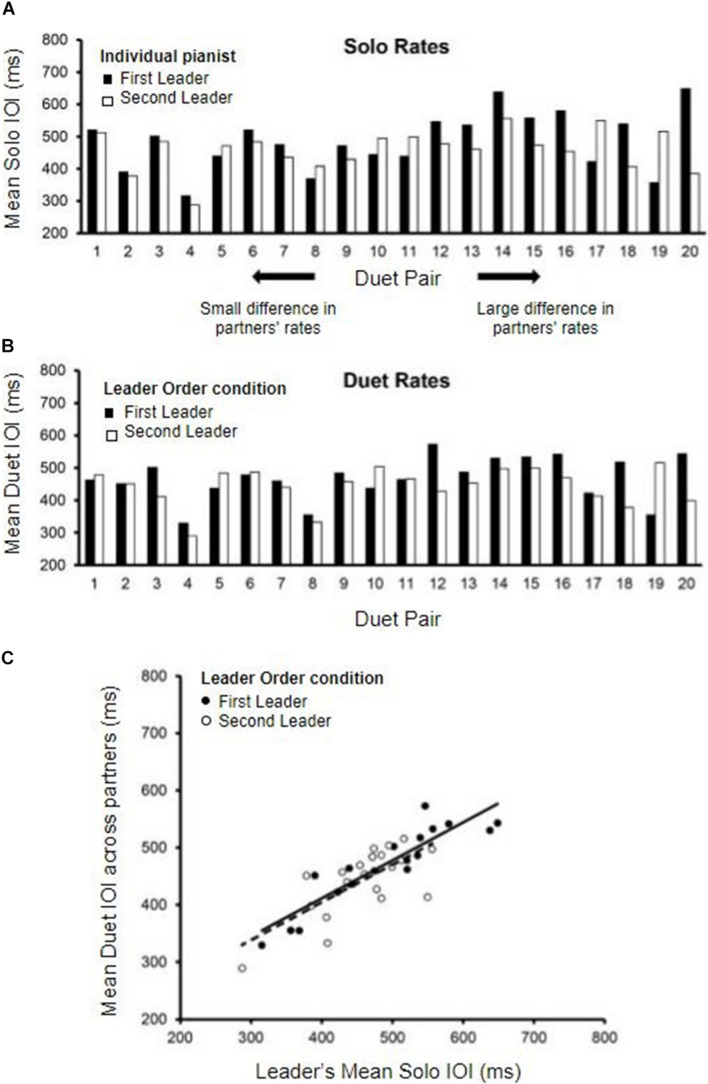
FIGURE 2.
Solo and Duet performance rates. (A) Mean Solo performance rates for individual partners; partners are labeled by who served as Leader in the First-Leader (black bars) and Second-Leader (white bars) Duet conditions. Pairs are ordered by the magnitude of difference in partners’ Solo rates (smallest difference on the left, largest on the right). (B) Mean Duet performance rates for each pair (averaged across partners) in the First-Leader (black bars) and Second-Leader (white bars) conditions. Pairs are ordered the same as in panel (A), by the magnitude of difference in partners’ Solo rates. (C) Leaders’ mean Solo performance rates (x-axis) correlated with Mean Duet performance rates (y-axis) in the First-Leader (black dots) and Second-Leader (white dots) conditions, with trend lines (solid = First-Leader condition; dashed = Second-Leader condition). Each dot represents data from one pair.

