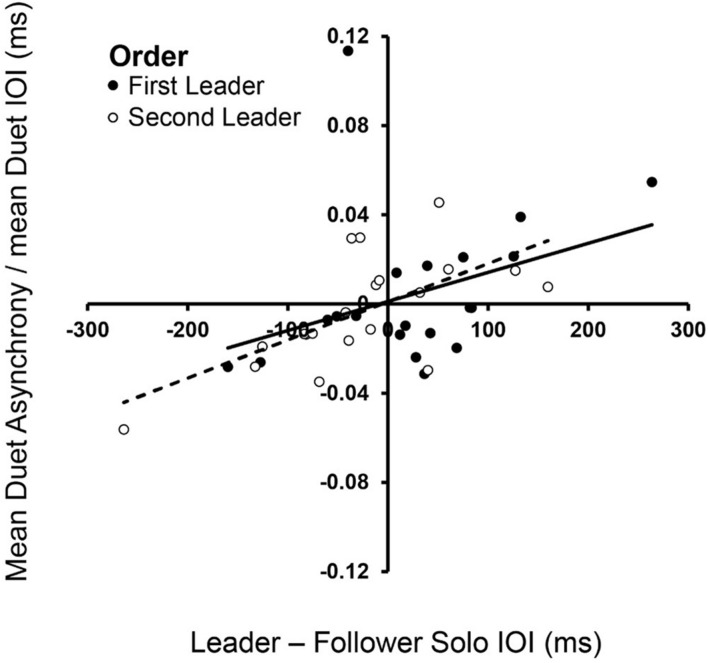
FIGURE 3.
Spontaneous frequencies in Solo performance influence Duet synchronization. Signed differences in partners’ mean Solo rates (Leader Solo mean IOI—Follower Solo mean IOI, x-axis) correlated with signed Duet tone onset asynchronies (Leader tone onset—Follower tone onset, divided by mean Duet performance rate) in First-Leader (black dots) and Second-Leader (white dots) conditions. Each dot represents data from one pair.

