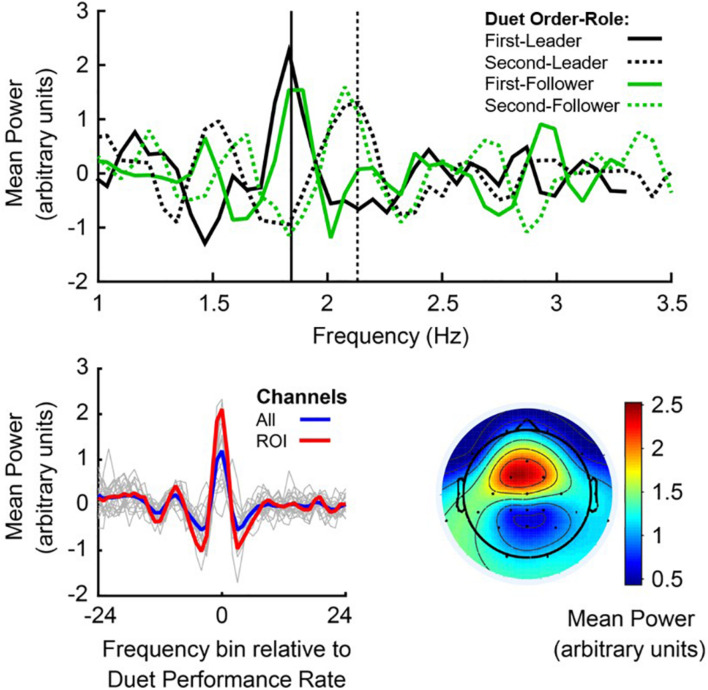
FIGURE 4.
Power Spectral Density, centered at the Duet performance rate. Top panel: Noise-normalized power spectra from a sample pair of duet pianists for First-Leader (solid lines) and Second-Leader conditions (dashed lines), where the Leader’s mean Power in each condition is shown in black and the Follower’s mean Power in each condition is shown in green. Frequency (Hz) is shown on the x-axis and mean noise-normalized power is shown on the y-axis. Vertical lines indicate the mean Duet performance rate (averaged across partners) in Hertz (# tones per second) in First-Leader (solid vertical) and Second-Leader (dashed vertical) conditions. Bottom panel (left): Mean power spectra centered at the frequency of each Duet performance, shown for each pair in thin gray lines and grand average across pairs in blue; a priori defined auditory-motor ROI (FC1, FC2, Fz, and Cz) in red. The zero-frequency bin on the x-axis represents each pair’s Duet performance rate (center of each spectrum). Bottom panel (right): Grand average topography of spectral power at the mean Duet performance rate (zero-frequency bin of left panel), averaged within pair across conditions and then across pairs.

