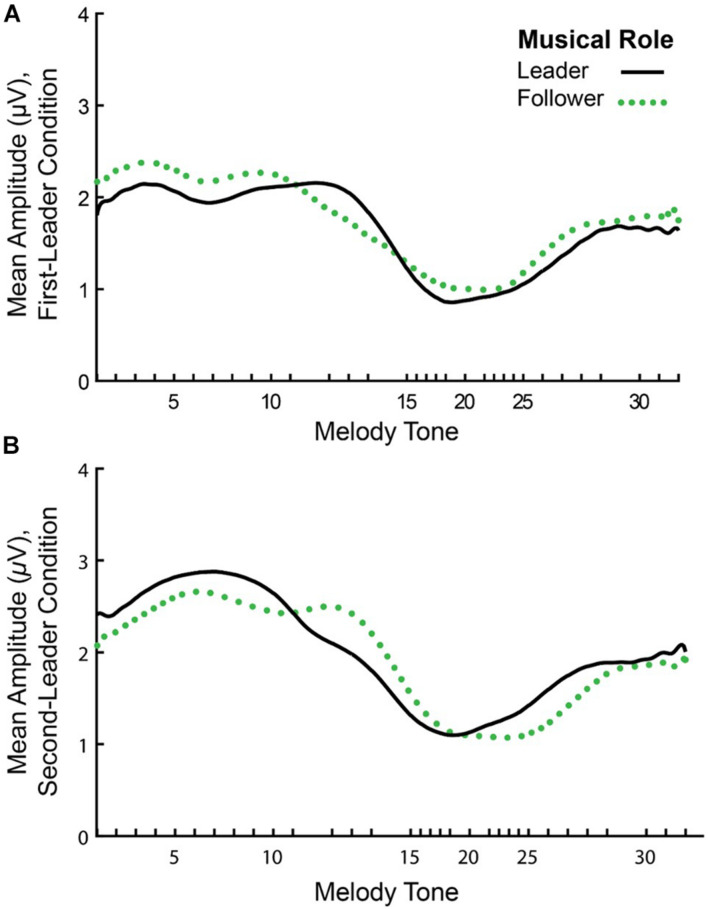
FIGURE 6.
Mean amplitude envelopes of one pair’s neural oscillations at the Duet performance rate. Timecourse of amplitude fluctuations in spectral energy at the Duet performance rate for a sample pair in the First-Leader (A) and Second-Leader (B) conditions. In each condition, the Leader’s mean amplitude envelope across 24 melody performances is shown in black (solid line) and the Follower’s mean amplitude envelope is shown in green (dotted line).

