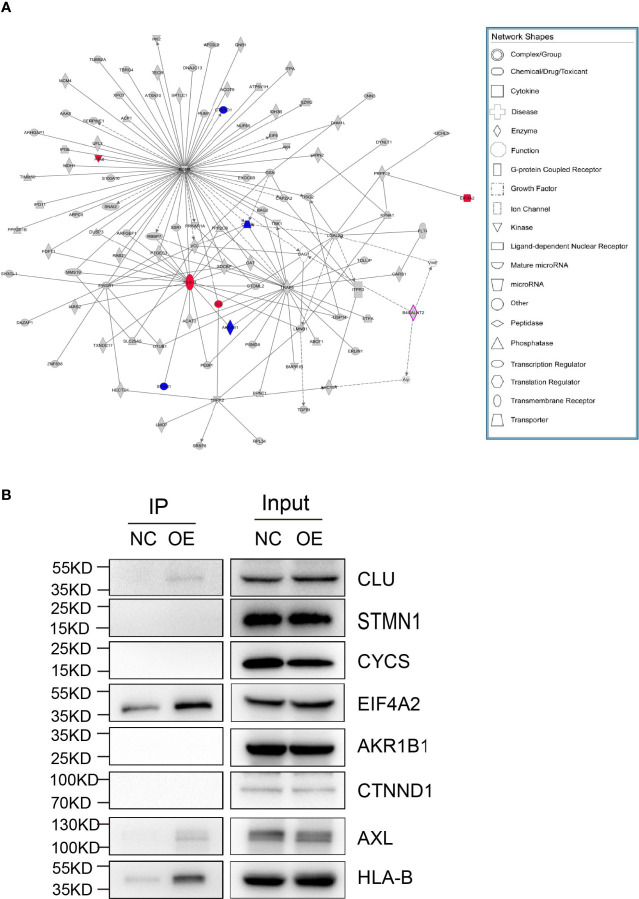
Figure 6.
Screening for interacting proteins. (A) The genes of the interaction proteins specifically identified in the OE group were identified according to the following conditions: 1) the genes should be predicted to interact with the target gene; 2) the genes should be related to proliferation and metastasis; 3) the genes should be star genes that are reported more frequently in tumors. Such genes were analyzed for gene interaction network, and 8 candidate interacting proteins were finally selected for subsequent Co-IP verification experiments according to relevant literature reports. (B) Co-IP validation was performed on 8 candidate interacting proteins. Eight different proteins (CLU, STMN1, CYCS, EIF4A2, AKRIB1, CTNND1, AXL and HLA-B) were checked for their potential interaction with target gene protein, where four of them (CLU, AXL, HLA-B and EIF4A2) exhibited such feature. The gene interaction network diagram shows the interaction relationship network between molecules within a defined functional region. In the network diagram, genes, proteins, chemical substances, and etc. are represented by different shapes. The gray node indicates that the gene belongs to the specific gene in the experimental group, the purple node indicates that the gene is the target gene, and the colorless node indicates that the gene is the added node gene.

