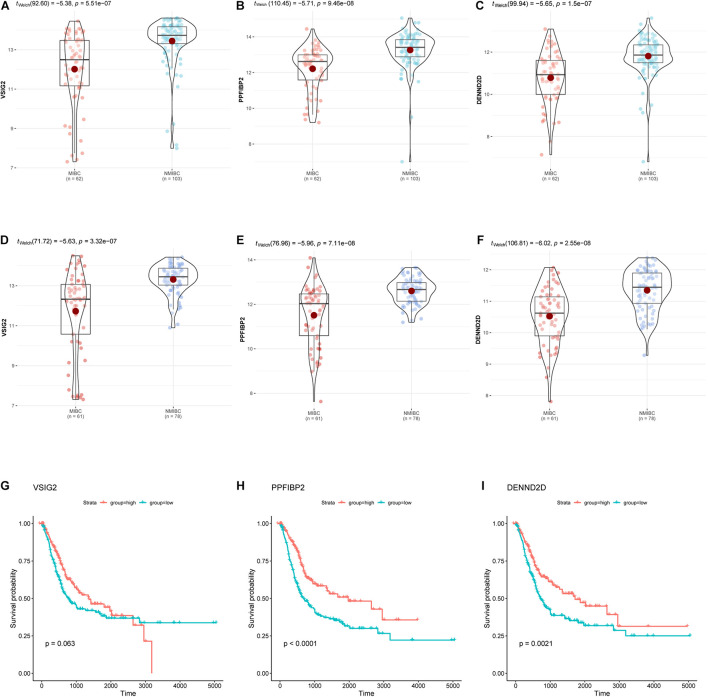
FIGURE 6.
The expression of hub genes (VSIG2, PPFIBP2, and DENND2D) in the GSE13507 dataset (A–C) and the GSE120736 dataset (D–F). Kaplan-Meier survival curves for patients with different expression levels of hub genes (G–I). The expression levels of groups were classified according to the median gene expression value.

