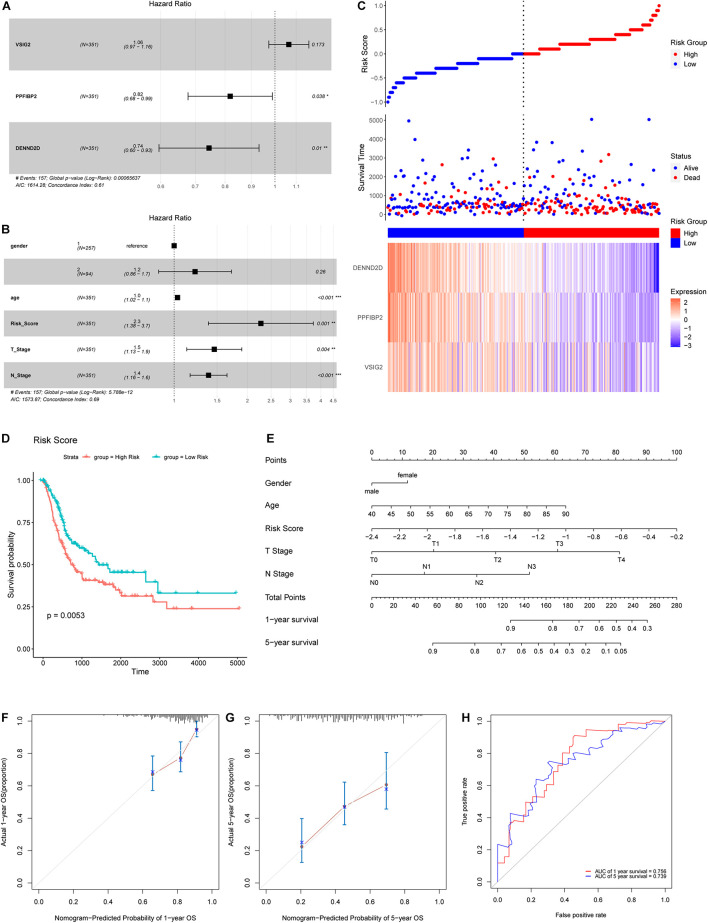
FIGURE 7.
(A) A Forest map of hub genes, as determined by multivariate Cox regression analysis. (B) A Forest map of risk score and other clinical features, as determined by multivariate Cox regression analysis. (C) Risk score distribution, survival status, and an expression heatmap for the three hub genes. (D) Kaplan-Meier survival curves for patients in the low- and high-risk groups. (E) Nomogram for predicting the 1- and 5-year OS of patients with BLCA. (F,G) A calibration curve of the constructed nomogram for predicting 1- and 5-year OS. (H) The time-dependent ROC curves for the constructed nomogram using the test data.

