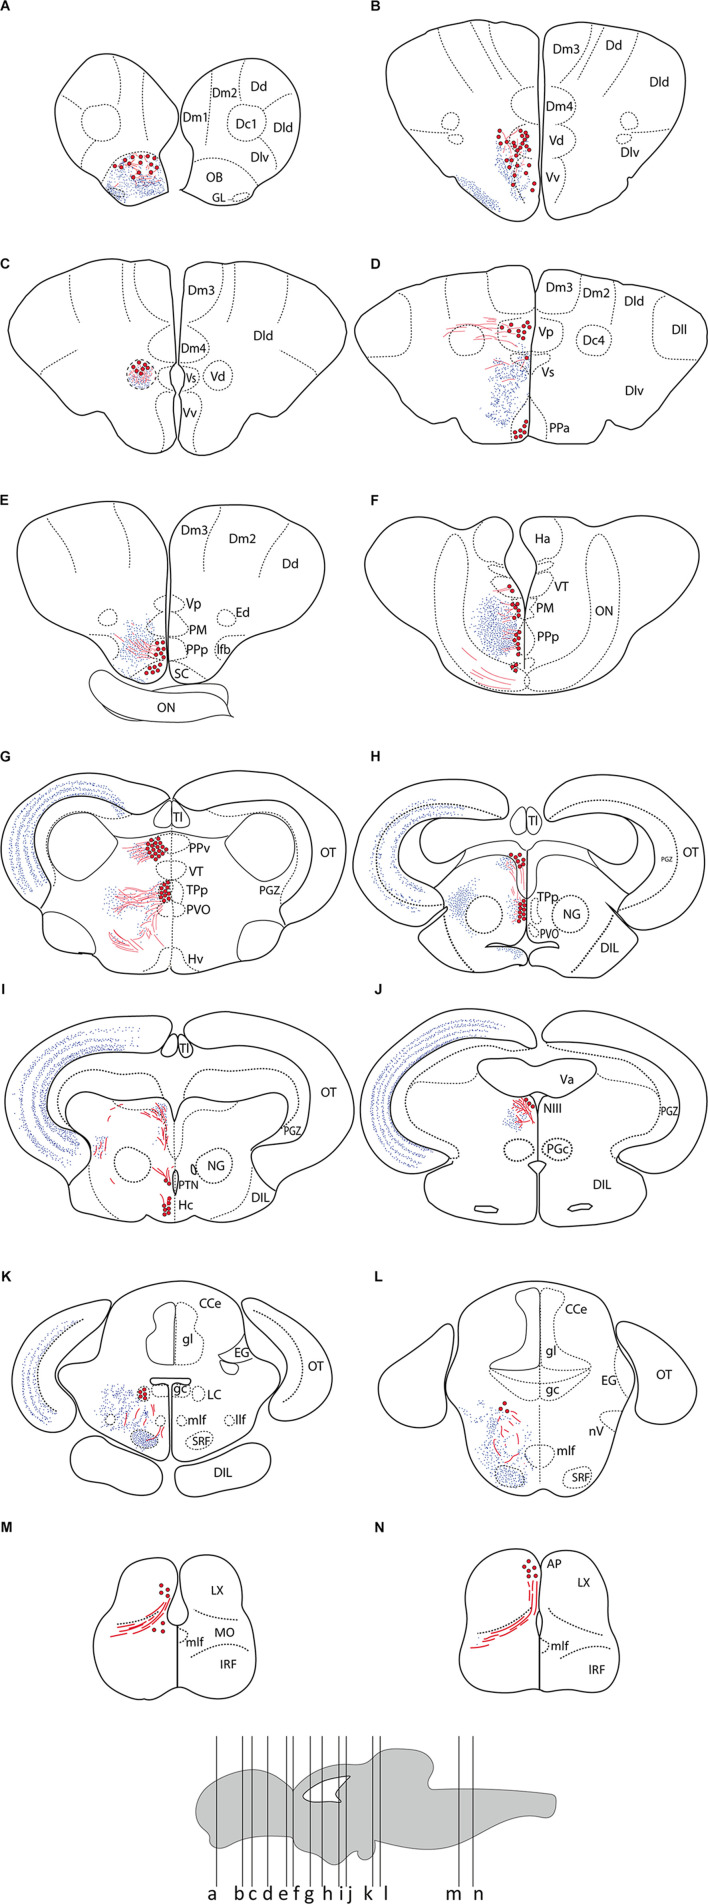
FIGURE 2.
Summary of TH immunoreactivity in the brain of Nothobranchius furzeri. (A–N) Diagrams of transverse sections showing TH+ cells bodies (large red dots), fibers (wavy red lines), and nerve terminals (small blue dots). The rostrocaudal level of each section is indicated in the lower brain scheme. See list of abbreviations, which applies to all figures.

