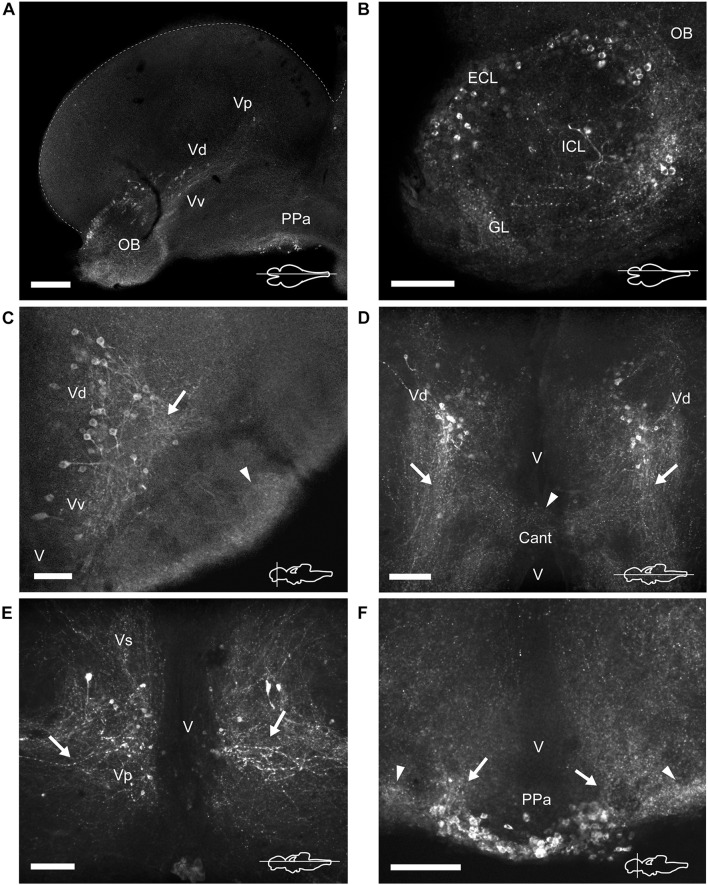
FIGURE 3.
TH immunoreactive neurons and fibers in the telencephalon and anterior preoptic area of Nothobranchius furzeri. (A) Para-sagittal section showing a panoramic view of TH+ neuronal groups in the olfactory bulb, subpallium and in the anterior preoptic nucleus. (B) Para-sagittal section showing the TH+ groups in the olfactory bulb. (C–E) Ventral telencephalic areas showing TH+ groups in the ventral, dorsal, supracomissural, and posterior zones. (C) Transverse section showing local TH+ processes of ventral/dorsal zones (arrow) and intense immunoreactive innervation at the ventrolateral edge of the telencephalon (arrowhead). (D) Horizontal section showing the caudalward projections of the dorsal zone (arrows) and the TH+ fibers at the level of the anterior commissure (arrowhead). (E) Horizontal section showing the lateral processes of the posterior zone (arrows). (F) Transverse section showing the TH+ neurons at the anterior preoptic nucleus. Arrows and arrowheads indicate the TH+ dorsocaudal projections of the anterior preoptic neurons and the lateral intense neuropil seen at each side of this cell group, respectively. For abbreviations see list. The orientation/level of sections is shown at the bottom right corner of each panel. Dorsal is to the top in transverse sections. Rostral is to the top and left, in horizontal and para-sagittal sections, respectively. Scale bars, 250 μm (A) and 100 μm (B–F).

